
Ticker
Last
High
Low
Daily Change (pip)
Daily Range (pip)
GBP/USD
1.3032
1.3058
1.2984
38
74
GBP/USD appears to be making a run at the monthly high (1.3126) as it initiates a series of higher highs & lows, but the 2Q U.K. Gross Domestic Product (GDP) report may undermine the rebound in Cable as the growth rate is expected to slow to an annualized 1.7% from 2.0% during the first three-months of 2017.
Another below-forecast GDP print may encourage the Bank of England (BoE) to preserve the record-low interest rate throughout 2017 as it dampens the risk for above-target inflation, and the majority of central bank officials may continue vote in favor of the wait-and-see approach as the U.K.’s departure from the European Union (EU) clouds the economic outlook with high uncertainty. As a result, GBP/USD may consolidate over the near-term as the technical outlook remains cluttered with mixed signals.
GBP/USD Daily
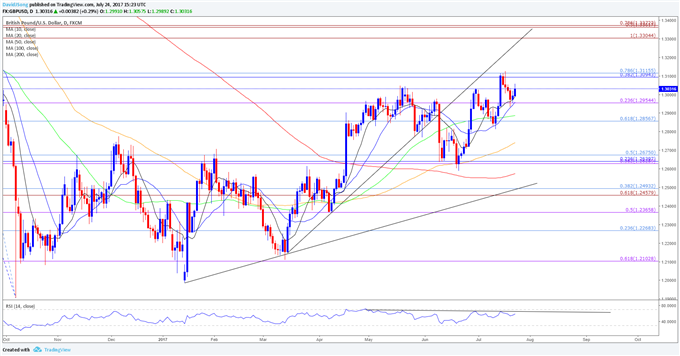
Chart – Created Using Trading View
Ticker
Last
High
Low
Daily Change (pip)
Daily Range (pip)
EUR/USD
1.1644
1.1684
1.1630
15
54


Leave A Comment