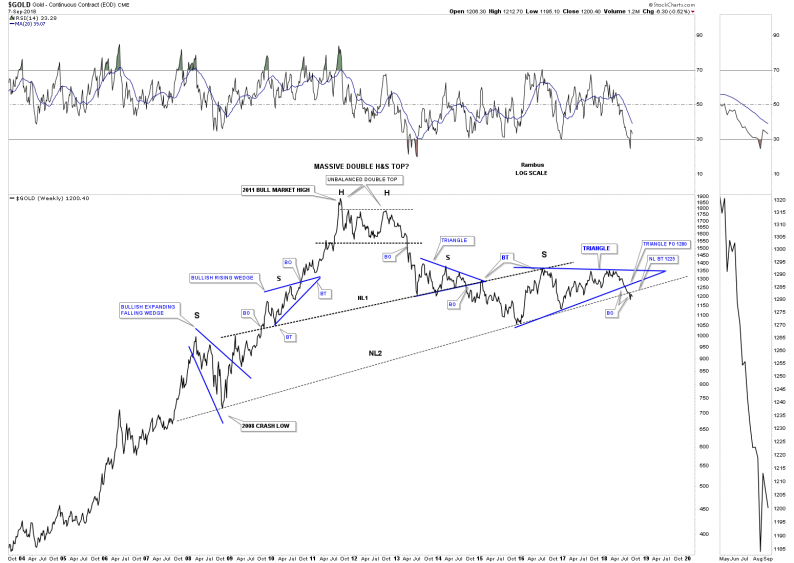
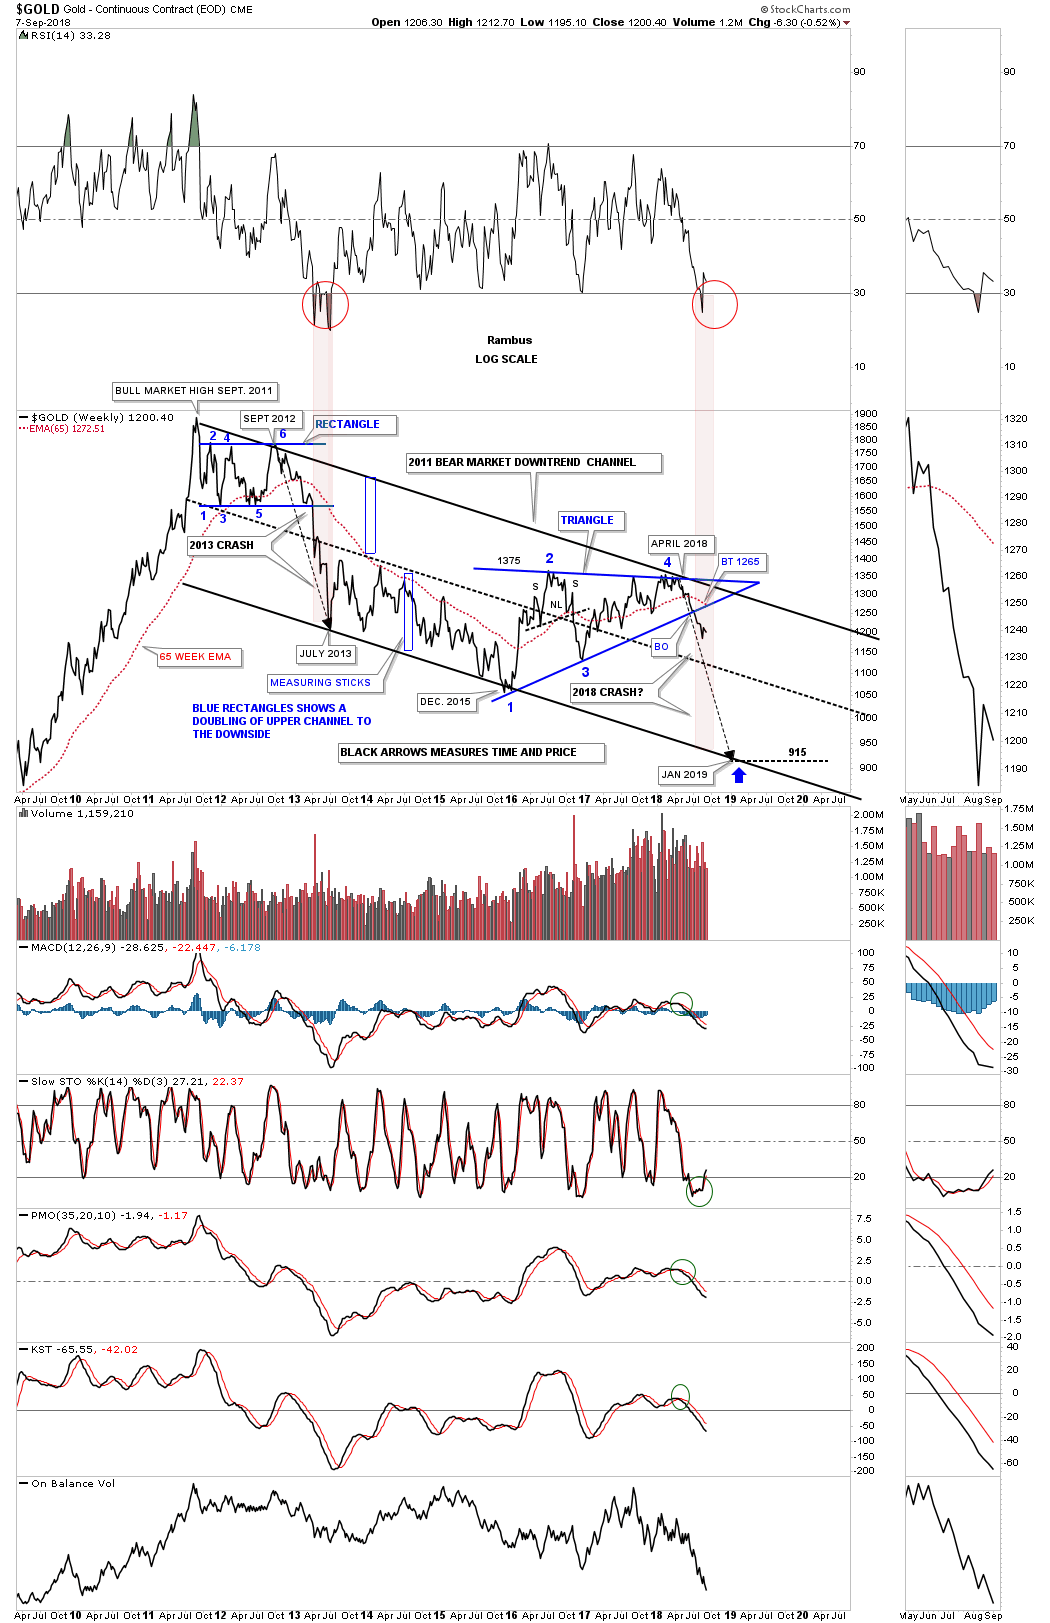
Tonight I would like to update some of the PM charts we’ve been following to see how they’ve been progressing starting with the massive ten year H&S top on gold. Since the price action broke below the neckline several weeks ago it’s a week to week observation to see how the backtest is playing out. The backtest to the neckline comes in around the 1225 area with this weeks high at 1212.70 so the backtest held for another week. What we need to see next for the current move lower to continue is to see a new weekly close below the previous weekly low.
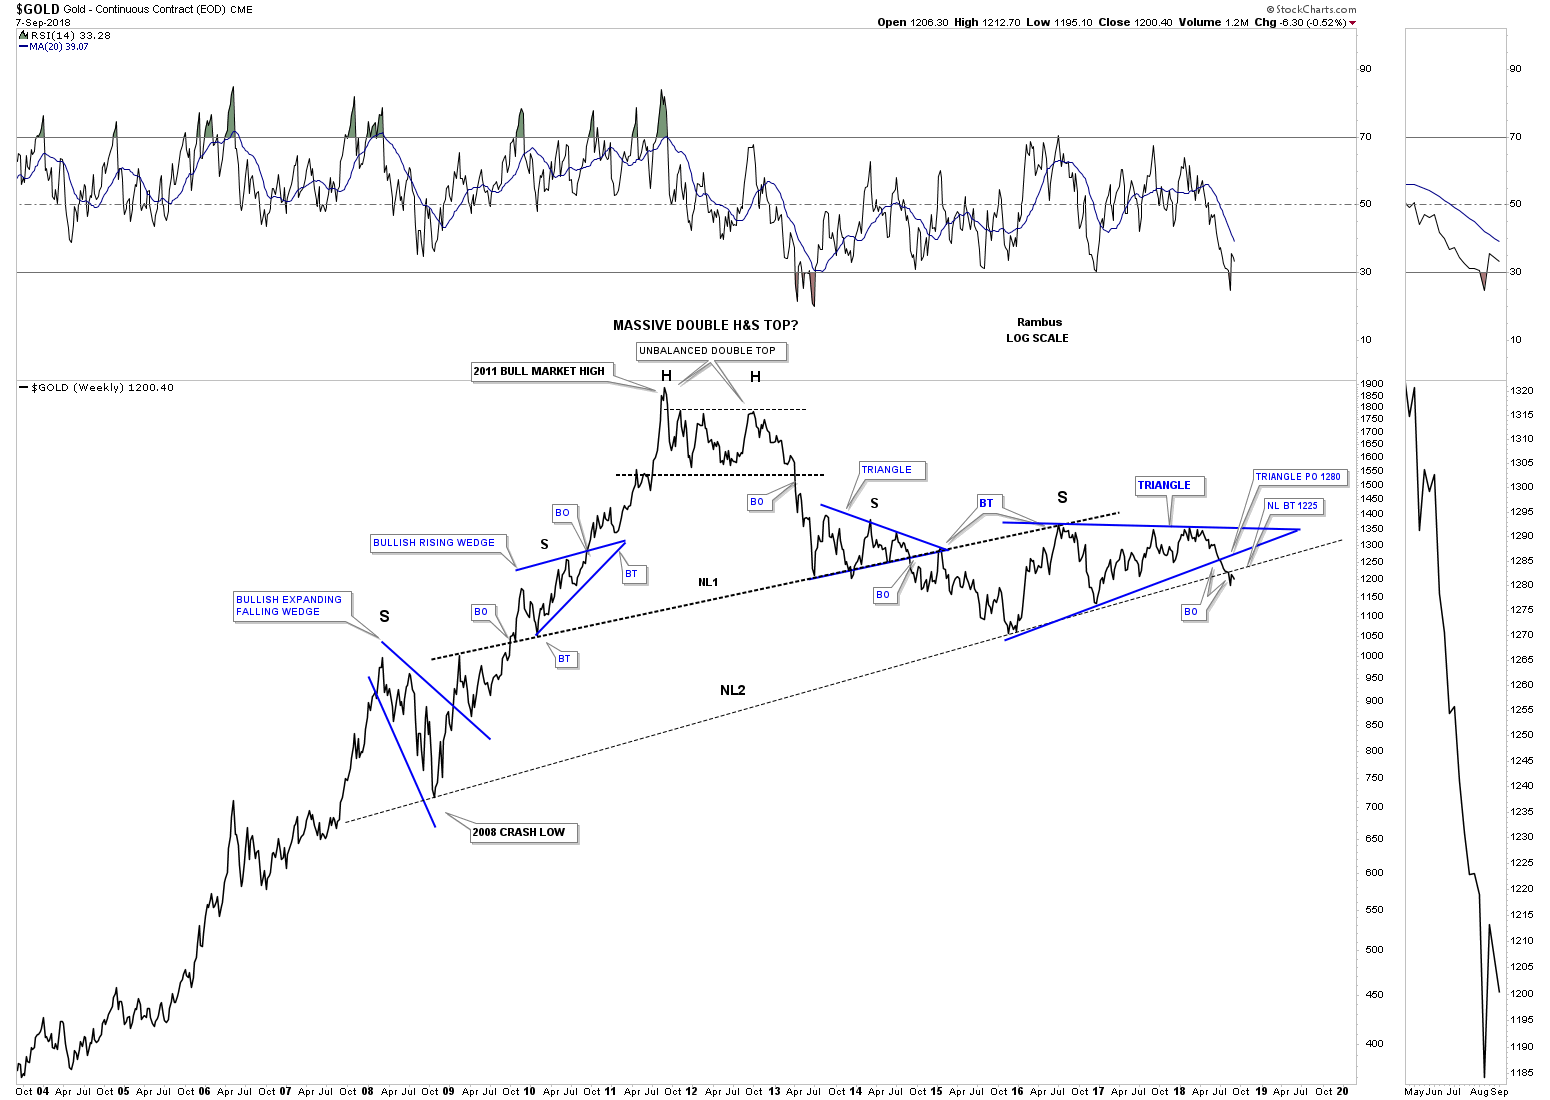
Below is a weekly bar chart for gold that goes all the way back to the beginning of the bull market in 2000.
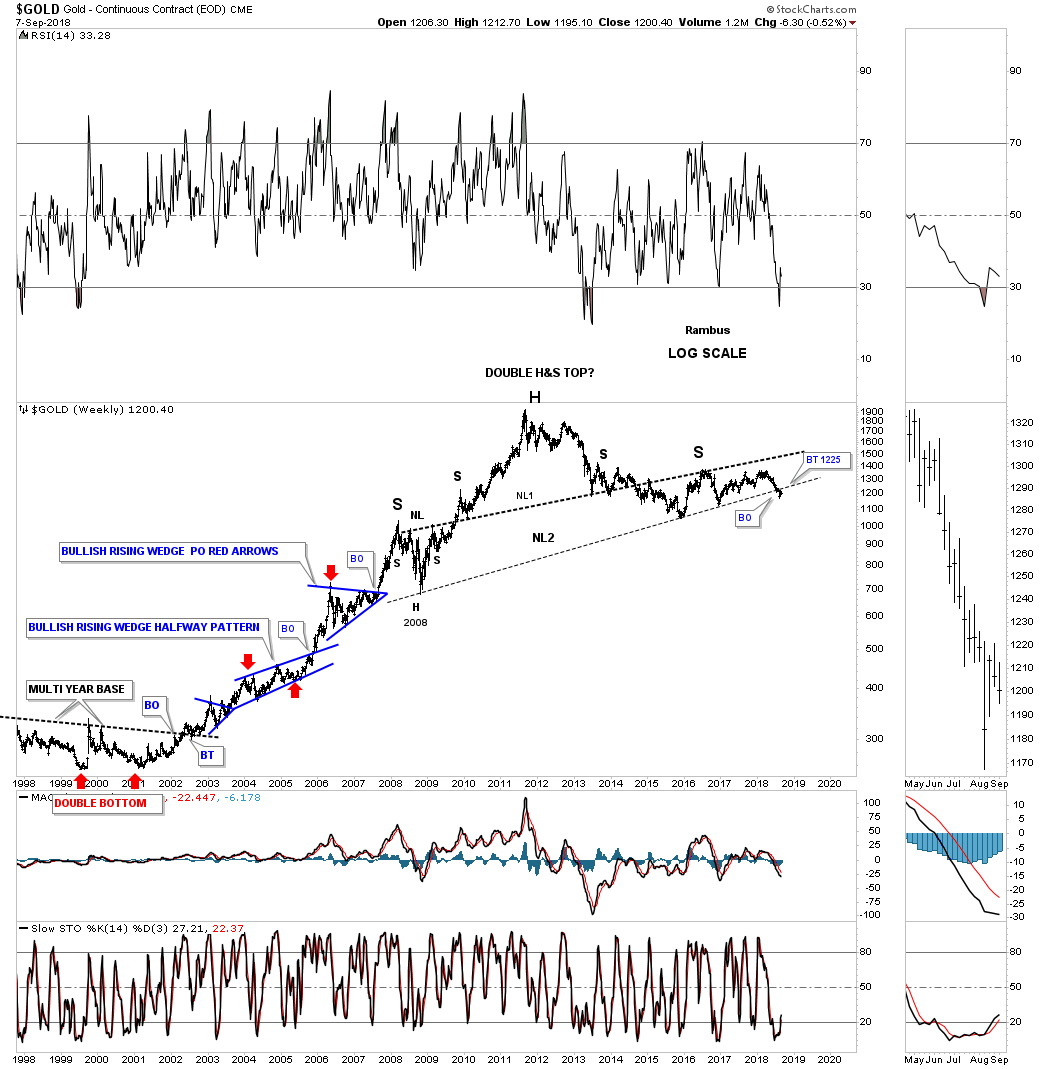
Next is the 50 year chart for gold which puts the ten year H&S top in perspecitive.
This next chart for gold is the weekly line chart which shows its 2011 bear market downtrend channel. Our current impulse leg down actually began in April of this year when the price action touched the top rail of the 2011 bear market downtrend channel and the top rail of the 2 1/2 year triangle. Currently the bottom rail of the 2 1/2 year triangle and the 65 week ema intersects at the 1270 area which would be maximum resistance.
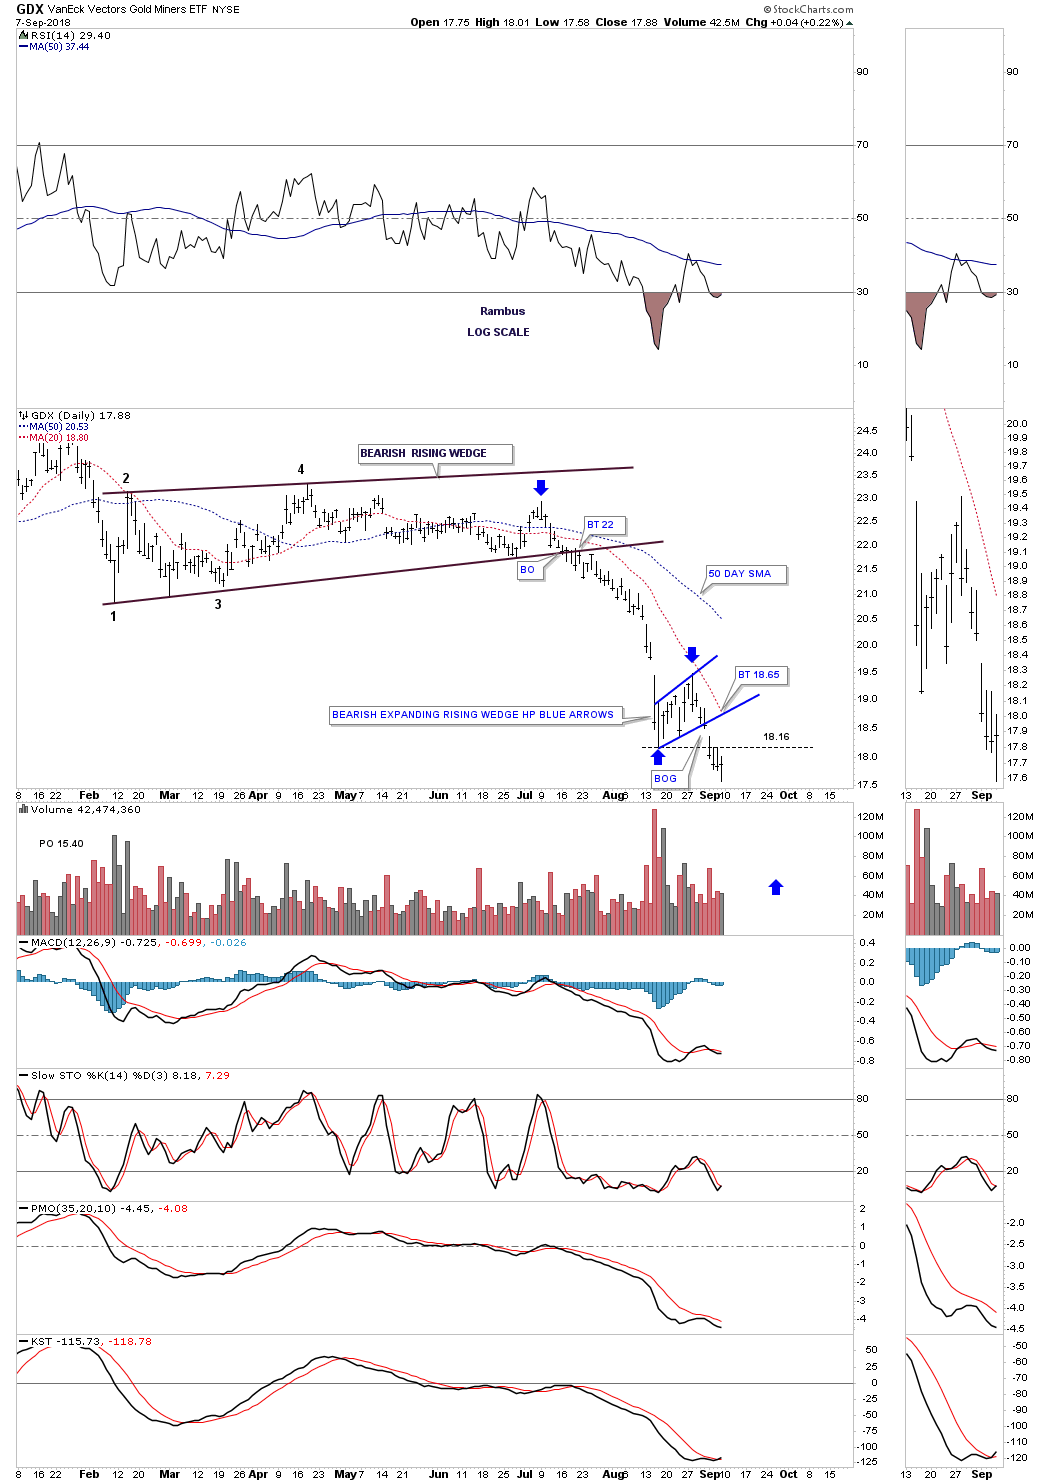
Next is a short term daily chart for the GDX which shows the impulse move down from the February bearish rising wedge.
This next chart for the GDX shows three dominate chart patterns starting with the 2016 H&S top reversal pattern, the February bearish rising wedge we just looked at on the daily chart above and the 1 1/2 year triangle consolidation pattern. These three pattern are building out the 2016 downtrend channel we’ve been following. The black arrows show the 1 1/2 triangle as a halfway pattern with the first led down off the 2016 top and our current 2018 impulse leg down moving at the same angle lower so far.
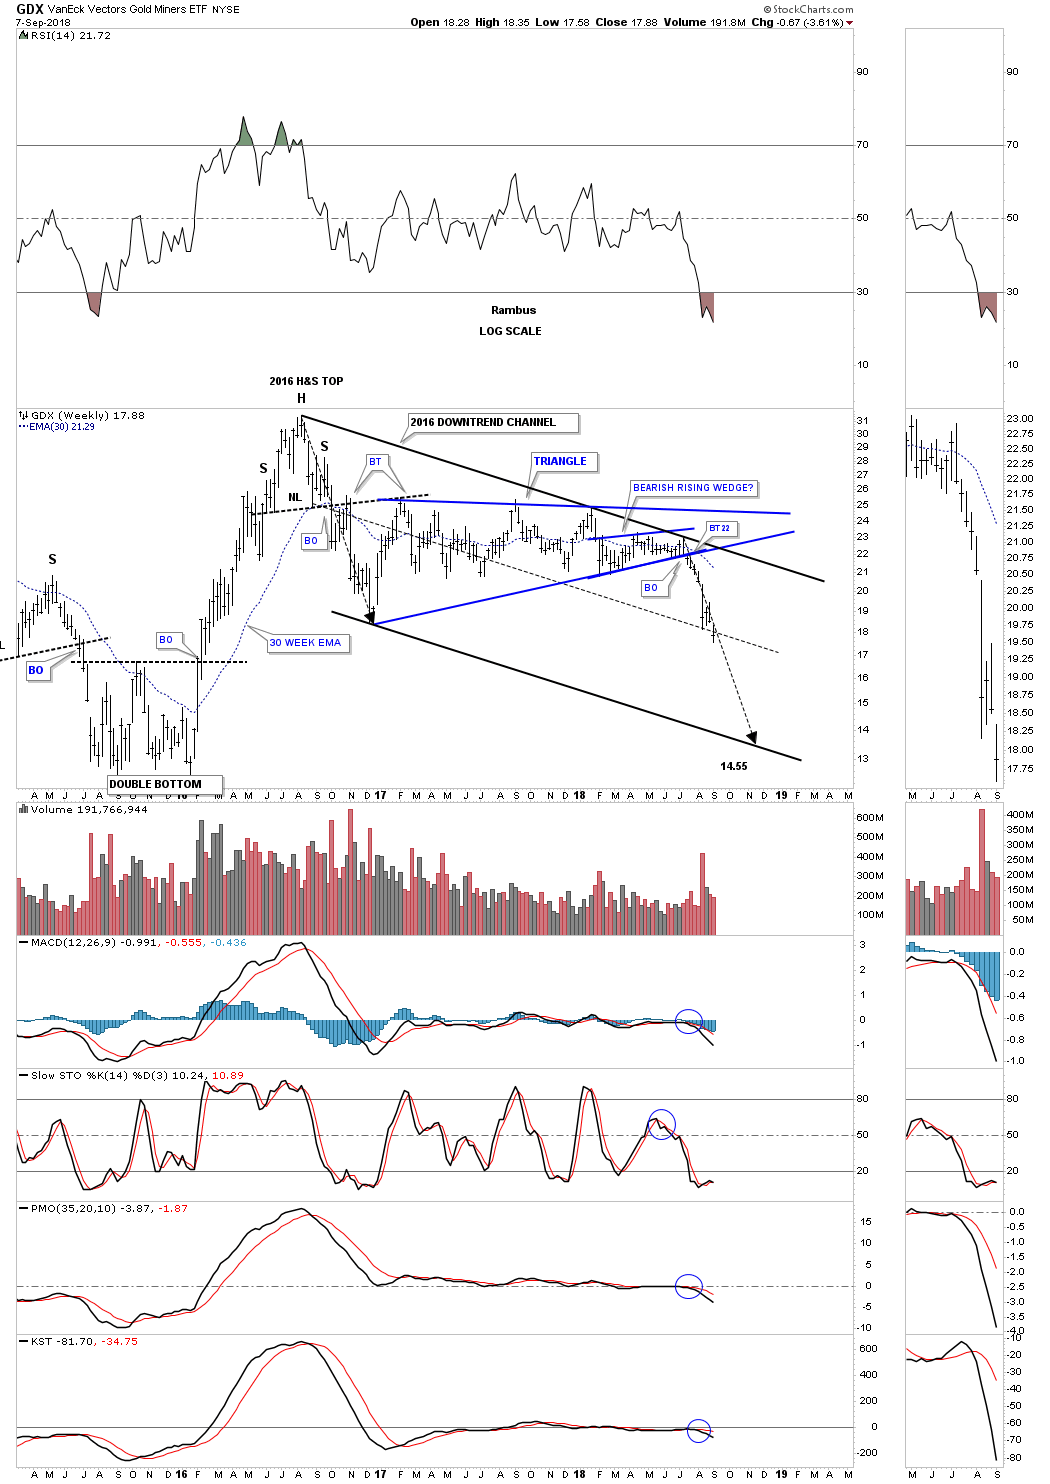
It’s hard to believe its been 8 weeks already since we looked at the breakout below the bottom rail of the year and a half triangle as shown by the red circle which showed a nice clean breakout. In 2015 when the GDX bottomed it built out a double bottom reversal pattern with the double bottom hump at the 16.25 area which might come into play as initial support. The HUI is already testing its 2015 double bottom hump currently.


Leave A Comment