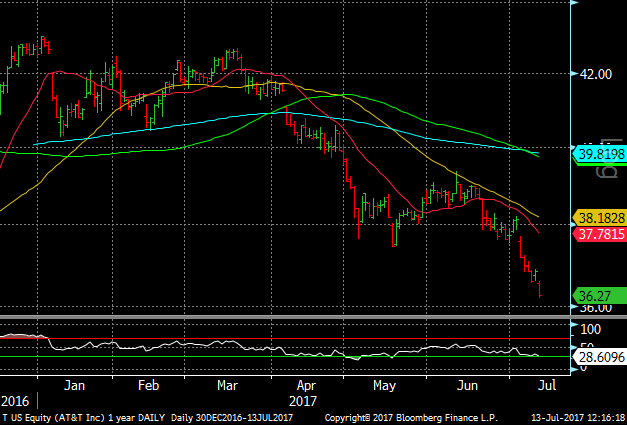
If you only look at daily charts you might be a SELLER too early. The daily chart for T is quite ugly as the slide below the 20 DMA and 50 DMA has continued. Long term oversold on daily chart.

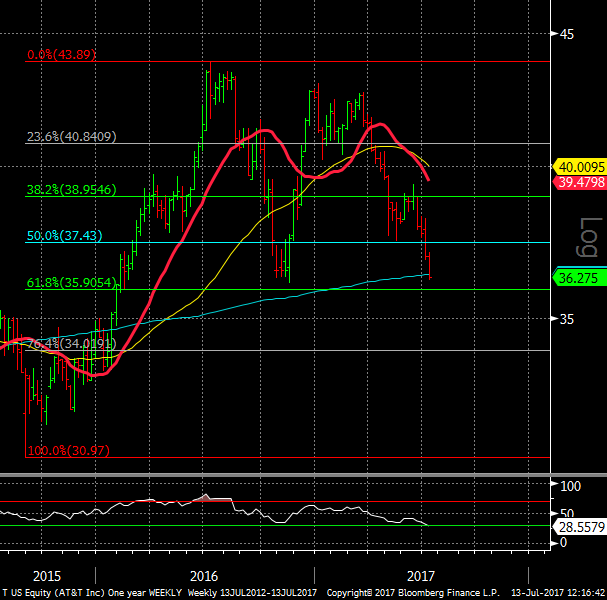
The weekly chart has T inside our long term bounce zone with 35.90 as the lower level. A close BELOW 35.90 is needed to exit longs. Long term oversold on weekly chart.


Leave A Comment