
The U.S. stock market indexes lost between 0.4% and 1.0% on Friday, extending their short-term fluctuations, as investors reacted to the monthly jobs data release along with some quarterly corporate earnings releases. The S&P 500 index remained above the level of 2,700, following Wednesday’s breakout. It was 11.5% below September the 21st record high of 2,940.91 on Monday a week ago. And now it trades 7.4% below the all-time high. The Dow Jones Industrial Average lost 0.4% and the Nasdaq Composite lost 1.0% on Friday.
The nearest important level of resistance of the S&P 500 index is at around 2,750-2,760, marked by the previous level of support and Friday’s daily high. The next resistance level is at 2,780-2,800, marked by mid-October consolidation. On the other hand, the level of support is now at around 2,685-2,705, marked by last Wednesday’s daily gap up of 2,685.43-2,705.60. The next support level remains at 2,630-2,650.
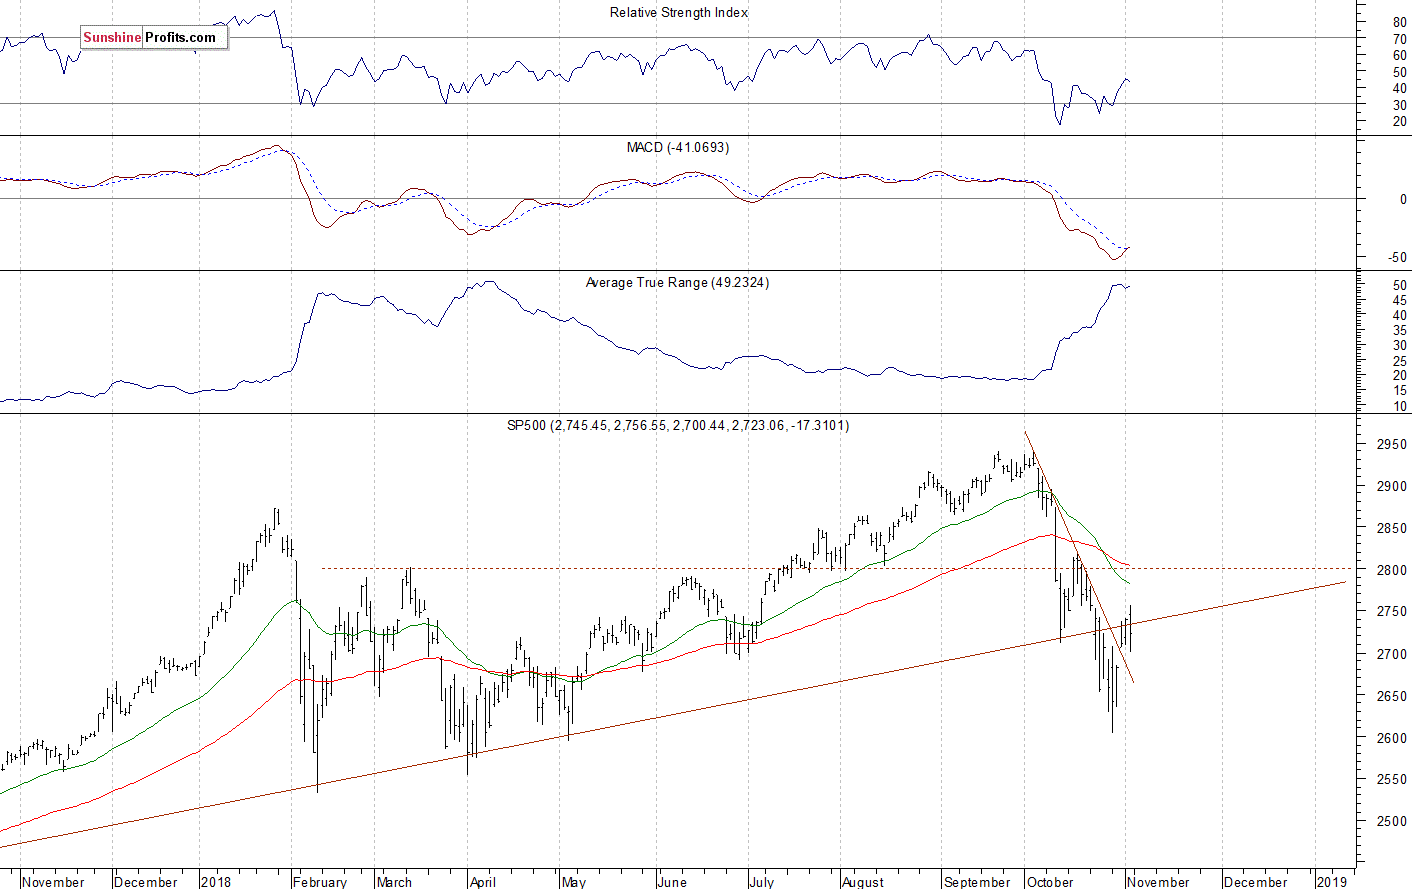
The broad stock market extended its downtrend a week ago, as the S&P 500 index fell closer to 2,600 mark. Then it bounced sharply and accelerated higher on Wednesday. For now, it looks like an upward correction within a downtrend. However, if the index breaks above 2,750, we could see more buying pressure. The market is at the broken long-term upward trend line, as we can see on the daily chart:
Slightly Positive Expectations
Expectations before the opening of today’s trading session are slightly positive, because the index futures contracts trade between +0.2% and +0.3% vs. their Friday’s closing prices. The European stock market indexes have gained 0.2-0.5% so far. Investors will wait for the ISM Non-Manufacturing PMI number release at 10:00 a.m. The broad stock market may extend its short-term fluctuations today. The S&P 500 got closer to the important resistance levels and we may see some more profit-taking action.


Leave A Comment