
(T2108 measures the percentage of stocks trading above their respective 40-day moving averages [DMAs]. It helps to identify extremes in market sentiment that are likely to reverse. To learn more about it, see my T2108 Resource Page. You can follow real-time T2108 commentary on twitter using the #T2108 hashtag. T2108-related trades and other trades are occasionally posted on twitter using the #120trade hashtag. T2107 measures the percentage of stocks trading above their respective 200DMAs)
T2108 Status: 70.3% (Overbought day #1)
T2107 Status: 69.7%
VIX Status: 10.8
General (Short-term) Trading Call: neutral
Active T2108 periods: Day #234 over 20%, Day #54 over 30%, Day #53 over 40%, Day #51 over 50%, Day #2 over 60%, Day #1 over 70% (overperiod, ending 13 days under 70%)
Commentary
I noted in my last T2108 Update that my bearish trading call was not likely to last much longer. Sure enough, the bulls and buyers put on a display that convincingly confirmed the previous day’s bullish moves. The S&P 500 (SPY) cleanly broke out and broke away from a frustrating trading range that had been in place since December 8, 2016.
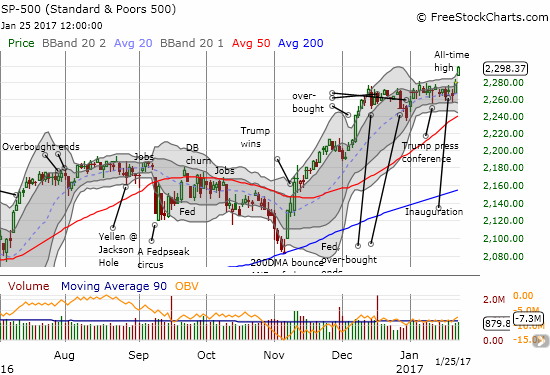
The S&P 500 broke out in convincing fashion with a 0.8% gain to another all-time high.
Unlike the previous day, T2108, the percentage of stocks trading above their respective 40-day moving averages (DMAs), confirmed the bullish tone on the day with a jump into overbought territory. The close just above the 70% threshold marked the fourth trip into overbought conditions over the past 6 weeks. This churn tempers my desire to flip the short-term trading call from bearish to bullish, so I am compromising with a neutral rating. I expect this neutral stance to stay in place for the duration of this overbought period.
I am particularly cautious because the VIX, already low the previous day, is now scratching at rock bottom levels. The volatility index has not been this low since July 3, 2014. In fact, reaching prior to June 6, 2014, the VIX was last this low on February 22, 2007. That day ended an incredible run of complacency with the VIX below today’s level for 48 trading days out of 90 starting October 13, 2006. In other words, the odds do not favor the VIX staying this low for much longer. If the VIX DOES manage to sustain a historic run of rock bottom levels, the event could exhaust buyers enough to carve out a major top in the stock market. This is a scenario to keep in the back pocket for now: it is too early to make such projections. (Historical data from Yahoo Finance).


Leave A Comment