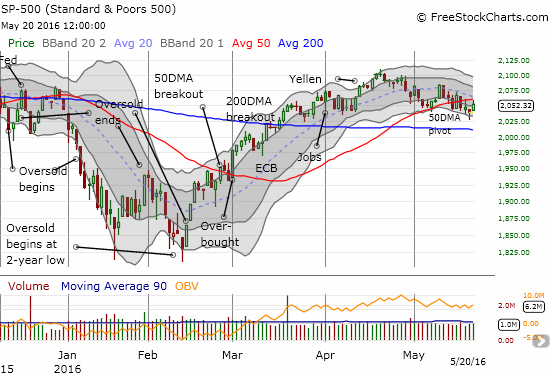
To start the last week of trading, I wrote “Another Buyer’s Surprise Signals Chop Ahead.” The week ended with buying as well, but it just barely kept change for the week in positive territory. The S&P 500 (SPY) gained 0.6% to finish 5 1/2 points higher than the previous Friday’s close. The chart below shows that the index has clearly broken down below support at its 50-day moving average (DMA). Yet, the buying to end the week printed important follow-through to a potential bottoming pattern on Thursday in the form of a “hammer.” I cannot get overly excited about the bottoming because the S&P 500 has been trapped in a chopfest for the last two months. This hammer likely marks the bottom of a range, not the start of a big new rally.

The S&P 500 (SPY) tries to carve out a shallow bottom.
The weekly chart reminds us how the S&P 500’s momentum came to a complete stop in late 2014. The subsequent chopfest has driven the index into the deep depths of selling and sent it soaring through breathtaking comebacks. IF the index cannot break through recent highs, we should expect the next sell-off to at least challenge recent lows, if not break them. Note even how volume has tended to dry up going into the peaks and surge going into the lows. For now, I continue to expect a lot of chop in the immediate area that will frustrate/excite bears and bulls alike.

Source: StockCharts.com
On a weekly basis, the S&P 500 is chopping downward with very wide swings.
T2108, the percentage of stocks trading above their 40DMAs, is playing the role of bear while also supporting the potential for a bottom.
T2108 has slipped into a persistent downtrend which indicates that the underlying market is weakening a lot more than the major indices tell us. In other words, more and more stocks are dropping out of supportive near-term trends. That message comes from the bear.
The bulls can point to a brief dip below 40% as the first sign that the market’s latest breakdown could be ending. In years past, I noticed that T2108 in the 30s sufficiently flagged an end to a selling trend. Granted, this was during the long stretches of strength in the stock market where T2108 simply refused to drop into oversold territory. Still, I have to respect the quick bounce out of the 30s to upgrade my short-term trading bias from bearish back to “cautiously bearish.” I will not switch back to a bullish bias until the S&P 500 (SPY) breaks through resistance with convincing follow-through. That weekly chart simply appears too ominous to do otherwise.
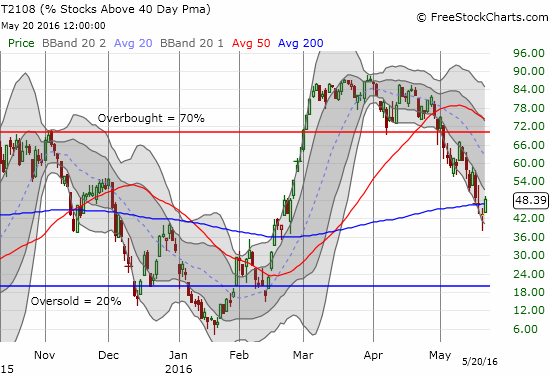
T2108 has finally attempted a bottom to a persistent trend of weakness.
T2107, the percentage of stocks trading above their respective 200DMAs, has trended down in very small “baby steps.” The good news for bulls is that the longer-term health of the stock market still looks relatively healthy. I will worry a LOT more if this downtrend resumes from here.


Leave A Comment