
2017 has just ended so it is a good time to make predictions for 2018. However, the problem is that I do not make predictions – I have no crystal ball and no idea what will happen this year. The only thing I can do reliably is to look at the current state of a few financial markets and discuss the patterns they present.
Let me apply this approach to the gold and silver markets. As usually, I am going to use the data delivered by the Commitments of Traders reports.
Silver
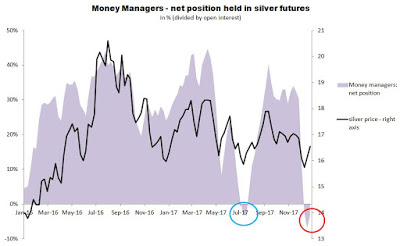
From the contrarian perspective silver looks very attractive. For example, Money Managers, big speculators trading silver futures, hold a net short position (the red circle):
Source: Simple Digressions and the COT data
Last time they were that pessimistic about silver was July 2017 (the blue circle). At that time Money Managers were also holding a net short position in silver futures. Then, over the next two months the prices of silver went from $15.6 to $18.2 per ounce (an increase of 16.7%).
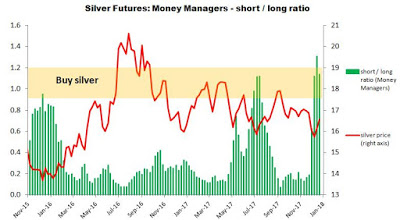
Another example – the ratio defined as: Gross short position held by Money Managers / gross long position held by Money Managers
Now the ratio stands at 1.14 which means that the majority of speculators are betting on lower prices of silver:
Source: Simple Digressions and the COT data
In the past, when the ratio was in the area marked in yellow, silver presented an excellent medium-term (up to six months) buying opportunity. As the chart shows, the ratio is once again in that area.
Gold
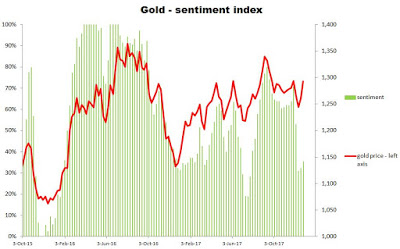
Although gold looks less attractive than silver (from the contrarian perspective), it is still a buying opportunity. My self-invented gold sentiment index is below 40%. In most cases such a low reading indicates pessimism among big speculators trading gold futures (but it is not excessive pessimism):
Source: Simple Digressions


Leave A Comment