In December 2015, the U.S. Congress voted to lift its four decade-long ban on the export of crude oil from the United States to other nations.
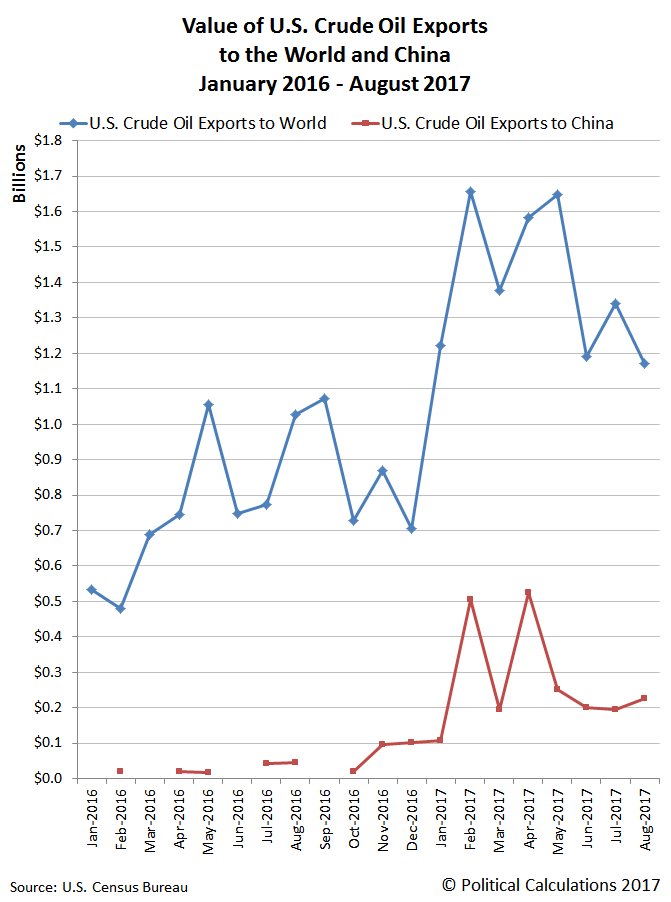
In the following chart, you can see how monthly exports of crude oil have changed since that arbitrary restriction on trade was lifted, where we’ve focused on both the U.S.’ total exports of crude oil to the world and to the nation that has become the U.S.’ largest market for its domestically-produced crude oil: China.

As you can see in the chart, while U.S. crude oil exports increased in 2016, it wasn’t until 2017 when China became a major customer that they stepped up to a whole new level. The addition of crude oil exports has both boosted the U.S.’ GDP and has helped contribute to reducing its relative trade deficit with China.
Through August 2017, those levels remain well elevated over the previous year’s figures, even though August 2017 saw the closure of the Gulf Coast ports through which the U.S. exports much of its crude oil to global markets for several weeks following Hurricane Hugo. We’ll revisit this data in several months to check in on the post-hurricane recovery.
U.S. Census Bureau. U.S. Trade Online. [exports]. Accessed 10 October 2017.


Leave A Comment