We’re only a little more than a week into the Trump administration, and investors are already beginning to see volatility in the money and bond markets. Indeed, the flurry of executive order signings and comments from the president last week elicited varying responses depending on their tenor or content. In our opinion, fixed income investors are just beginning to see what could potentially lie ahead in terms of U.S. Treasury (UST) volatility, as the market digests the various twists and turns the upcoming fiscal policy debate may take.
There’s no doubt we are just in the early innings of this fiscal policy saga. As the headlines play out, it will be important to consider the fundamental backdrop of the U.S. economy leading into any potential forthcoming stimulus. In other words, what is the starting point for growth? The latest report from the Bureau of Economic Analysis (BEA) outlined the fact that the U.S. economy is still suffering from growing pains.
U.S. Real GDP
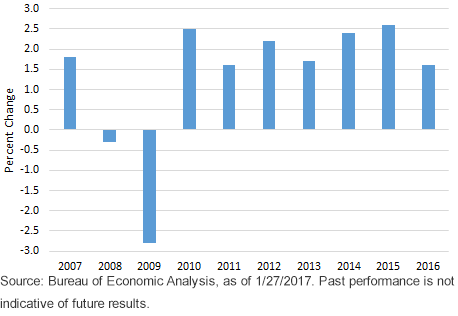
The above chart clearly illustrates the point that real GDP has experienced difficulties trying to break out from the great recession and has failed to grow beyond +2.6% in any calendar year since the economic downturn ended in 2009. In fact, overall growth has been only +2.1% over this 7½-year period. For the past calendar year, real GDP came in at +1.6%, the weakest annual showing in five years. In fact, the 2011 and 2016 performances were the lowest post-recession growth rates. As is often the case, the annual figure can mask what transpires on a quarterly basis. This was definitely the case in 2016, when growth got off to an anemic start of only +0.8% in Q1 and then topped out at +3.5% in Q3.
The BEA report also revealed that 2016 did not end on an overly robust note either, as real GDP came in at +1.9%, or 1.6 percentage points below the Q3 rate. Personal consumption continued to be a positive contributor during the period, while the next export component acted as a noticeable drag, reversing the pattern in trade seen for Q3. An interesting aspect to the GDP data came from the inventories grouping. This component added a full percentage point to growth in Q4, which prompts the question: Is this a sign of strength or potential weakness? Inventories can essentially increase for two reasons: 1) businesses voluntarily increase their positions because they foresee an increase in demand that will need to be met (a positive); or 2) positions were involuntarily increased because demand declined (a negative). Typically, an increase in inventories of the magnitude that was witnessed in Q4 tends to get reversed to some degree during the subsequent quarter. If this pattern holds true for the first quarter of this year, real GDP will already have a headwind to overcome.


Leave A Comment