During the throes of the 2008 bear market, I looked back at the Russell 2000 aghast and wondered to myself: how could I have missed something this obvious? Not to say that I wasn’t short and having a great year. On the contrary, it was (not surprisingly) the best trading year of my life. But the clarity of the pattern made me wonder why I didn’t just pour my life savings into $RUT puts and make a quadruple-digit percentage gain.

I vowed never to let something so “obvious” get away from me again.
Hence my fortitude with respect to the current market. In spite of countertrend rallies (sometimes, like today, multiple ones in the course of a single trading session), I am standing firm. I have my portfolio scattered, at the moment, over 136 different short positions, and I’m probably going to expand that to 150. There are simply too many good charts.
The guiding light to all of these positions is the huge dome pattern found on index after index, ETF after ETF. For instance, the NASDAQ Composite:

The Dow Industrials:

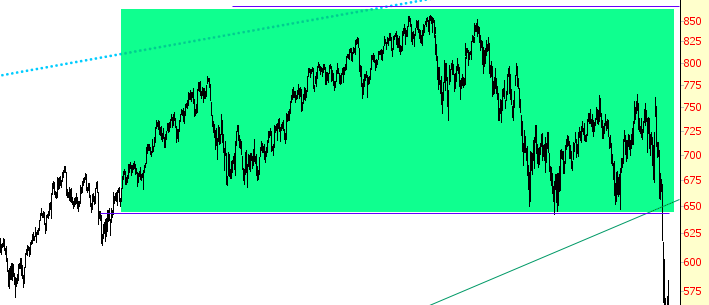
And the S&P 100:

For some bizarre reason, I have vowed to myself not to hold ETF positions overnight, but instead focus strictly on the very best individual equity positions. One example among these 136 is Manitowoc, which after hours is down about 6% as of this post.

That’s it from me today; see you in the morning!


Leave A Comment