
Breaking Below the Shelf
In our recent missive on junk bonds, we inter alia discussed the fact that the growth rate of the narrow money supply aggregate M1 had declined rather noticeably from its peak in 2011. Here is a link to the chart.
As we wrote:
“We also have confirmation of a tightening monetary backdrop from the narrow money supply aggregate M1, the annualized growth rate of which has been immersed in a relentless downtrend since peaking at nearly 25% in 2011. We expect that this trend will turn out to be a a leading indicator for the recently stagnant (but still high at around 8.3% y/y) growth rate in the broad true money supply TMS-2.”

Photo credit: Bari Goodman
In the meantime the data for TMS-2 have been updated to the end of October, and low and behold, its year-on-year growth rate has declined to the lowest level since November of 2008. At the time Bernankenstein had just begun to print like crazy, via all sorts of acronym-decorated programs (they could have just as well called them “print 1, print 2, print 3”, etc.). So we’re now back to the broad true money supply growth rate recorded at “echo bubble take-off time”.
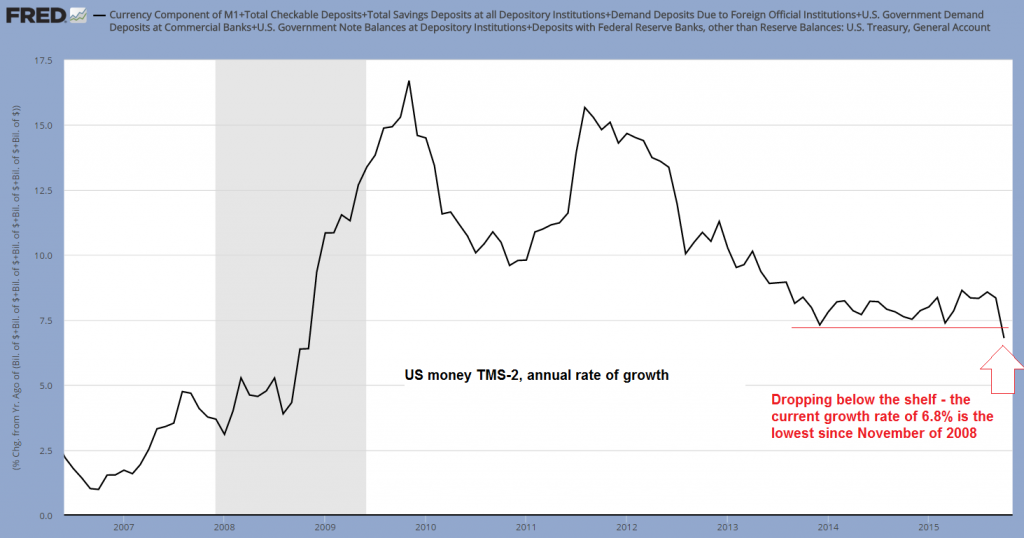
Annual growth rate of US money TMS-2, breaking below the lower end of the range it has inhabited since late 2013 – click to enlarge.
This is the final piece of the puzzle if it keeps up (and why wouldn’t it keep up?). Stock market internals have become ever more atrocious in the course of this year, which we have regarded as a sign that not enough new money was being printed to keep all the pieces of the bubble in the air at once. Now there is even less support.
Lest we forget, this is the Greenspan-Bernanke legacy in terms of money supply inflation in toto:
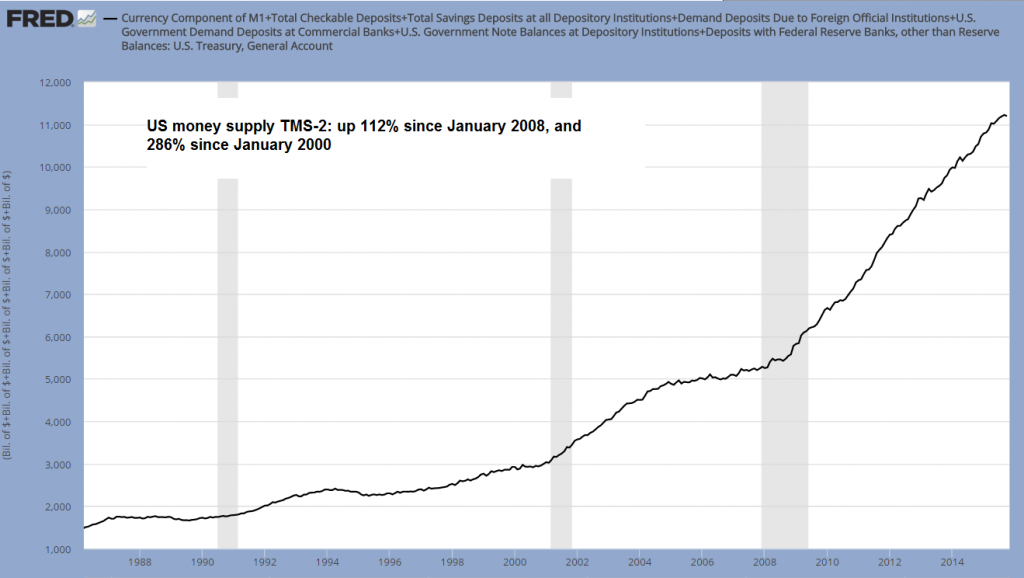
Money supply inflation in overdrive – the Greenspan-Bernanke (and now Yellen) era – click to enlarge.
Evidence of Malinvestment and Lunacy


Leave A Comment