
The Turkish crisis is spreading and causing a risk-off sentiment all over the world. The Japanese yen enjoys the safe-haven flows and rises, sending the USD/JPY tumbling down. What’s next?
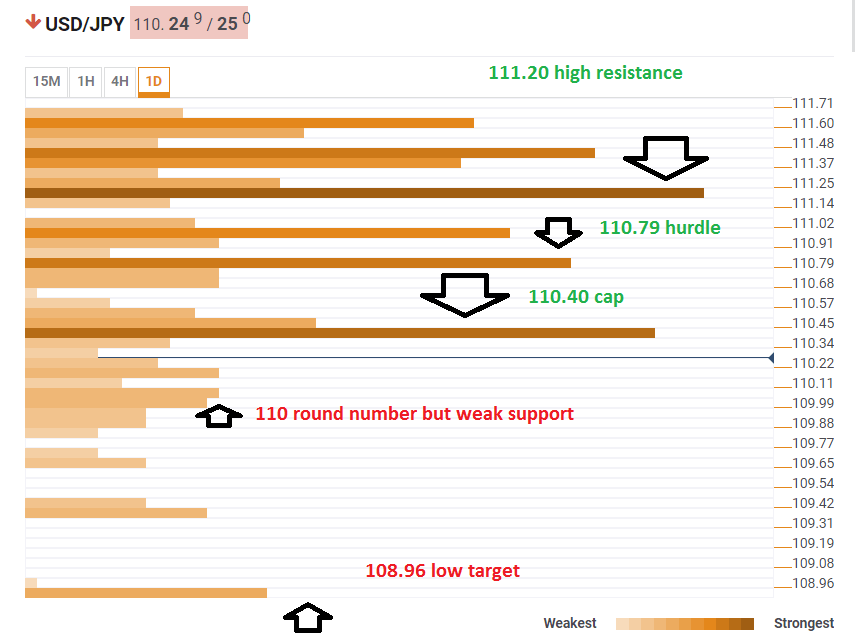
The Technical Confluences Indicator shows that the first step to recovery is overcoming 110.40, which is the convergence of the Bolinger Band one-day Lower, the Pivot Point one-month Support 1, and the Pivot Point one-week Support 1.
A move to the upside will hit another confluence zone at 110.79 with the Fibonacci 23.6% one-week, the Fibonacci 38.2% one-day, and the Simple Moving Average 10-4h.
Higher, 111.20 is the congestion of the Simple Moving Average 5-one-day, the Fibonacci 61.8% one-week, the Bolinger Band one-hour Upper, the Pivot Point one-day Resistance 1, and the one-day high.
Looking down, the pair has very little support. 110 is noteworthy as a round line and also the confluence of the SMA 200-one-day and the BB 15m-Lower, which are not that potent. Lower, 108.96 is the Pivot Point one-month Support 2.
All in all, the path of least resistance is undoubtedly to the downside.
Here is how it looks on the tool:
Confluence Detector
The Confluence Detector finds exciting opportunities using Technical Confluences. The TC is a tool to locate and point out those price levels where there is a congestion of indicators, moving averages, Fibonacci levels, Pivot Points, etc. Knowing where these congestion points are located is very useful for the trader, and can be used as a basis for different strategies.
This tool assigns a certain amount of “weight” to each indicator, and this “weight” can influence adjacents price levels. These weightings mean that one price level without any indicator or moving average but under the influence of two “strongly weighted” levels accumulate more resistance than their neighbors. In these cases, the tool signals resistance in apparently empty areas.


Leave A Comment