
Ticker
Last
High
Low
Daily Change (pip)
Daily Range (pip)
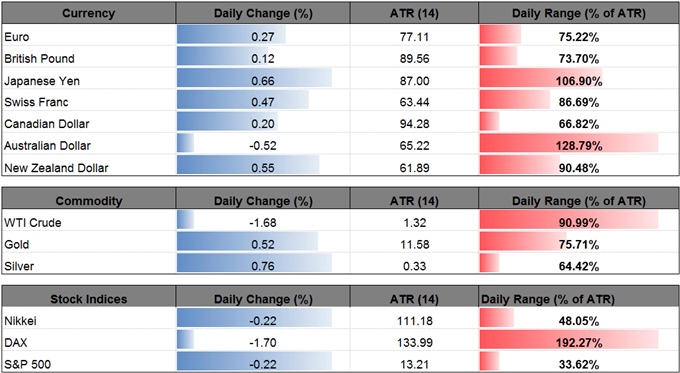
USD/JPY
111.17
112.08
111.15
74
93
The near-term outlook for USD/JPY appears to be unfazed by the dovish comments coming out of the Bank of Japan (BoJ) as the pair slowly works its way back towards the June-low (108.80).
USD/JPY slips to fresh monthly lows even as the Bank of Japan (BoJ) now expects to achieve the 2% inflation-target in fiscal-year 2019, and the pair stands at risk of facing additional losses next week should the Federal Open Market Committee (FOMC) show a greater willingness to retain the current policy for the foreseeable future. Despite talks of unloading of the balance sheet, Chair Janet Yellen and Co. may attempt to buy more time amid the mixed data prints coming out of the U.S. economy, and the greenback may struggle to hold its ground in the second-half of the year as Fed Fund Futures continue to show a 50/50 chance for another rate-hike in 2017.
USD/JPY Daily
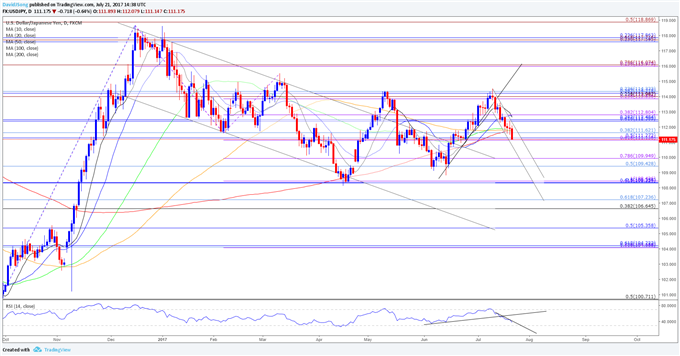
Chart – Created Using Trading View
Ticker
Last
High
Low
Daily Change (pip)
Daily Range (pip)
AUD/USD
0.7917
0.7959
0.7875
41
84


Leave A Comment