
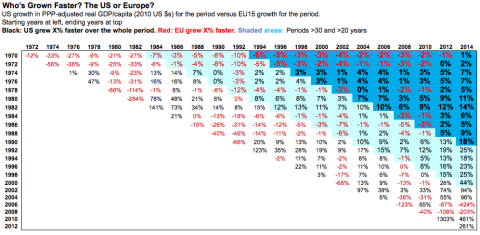
I’ve pointed out multiple times that despite Europe’s big, supposedly growth-strangling governments, Europe and the U.S. have grown at the same rate over the last 45 years. Here’s the latest data from the OECD, through 2014 (click for larger):
And here’s the spreadsheet. Have your way with it. More discussion and explanation in a previous post.
You can cherry-pick brief periods along the bottom diagonal to support any argument you like. But between 1970 and 2014, U.S. real GDP per capita grew 117%. The EU15 grew 115%. (Rounding explains the 1% difference shown above.) Statistically, we call that “the same.”
Which brought me back to a question that’s been nagging me for years: why hasn’t Europe caught up? Basic growth theory tells us it should (convergence, Solow, all that). And it did, very impressively, in the thirty years after World War II (interestingly, this during a period when the world lay in tatters, and the U.S. utterly dominated global manufacturing, trade, and commerce).
But then in the mid 70s Europe stopped catching up. U.S. GDP per capita today (2014) is $50,620. For Europe it’s $38,870 — only 77% of the U.S. figure, nagging me for years. What’s with that?
Small-government advocates will suggest that the big European governments built after World War II are the culprit; they finally started to bite in the 70s. But then, again: why has Europe grown just as fast as the U.S. since the 70s? It’s a conundrum.
I’m thinking the small-government types might be right: it’s about government. But they’ve got the wrong explanation.
Think about how GDP is measured. Private-sector output is estimated by spending on final goods and services in the market. But that doesn’t work for government goods, because they aren’t sold in the market. So they’re estimated based on the cost of producing and delivering them.


Leave A Comment