
Last week we pointed out both of the major market indexes had formed a cup-and-handle pattern, setting the stage for rekindled bullishness. Stocks just needed break above the cup’s brim line to get that ball rolling. FreepikThat happened on Monday, and the buyers never looked back. With the move underway, the doors are opened up to higher highs again. The only problem? Stocks are uncomfortably overbought now. A small slide lower might actually be the best-possible thing here, just to dial back some of the dangerous froth. More straightaway gains at the current pace are actually a bit dangerous, setting up a wave of profit-taking beginning early in the coming year… or maybe at the tail-end of this year. We’ll weigh it all in a moment. Let’s first look at last week’s biggest economic announcements and preview what’s coming this week. Economic Data Analysis On balance, the bulk of last week’s economic was bullish. Take inflation as an example. We’re still seeing price increases, but the pace of these price increases continues to slow. Although all of it is still above the Federal Reserve’s (somewhat unrealistic) Fed Funds Rate target of 2.0%, it’s curbed enough to let the Fed not impose a rate hike on Wednesday, and even entertain the possibility of rate cuts next year… presuming price increases continue to dwindle. Annualized Inflation Rate Charts
 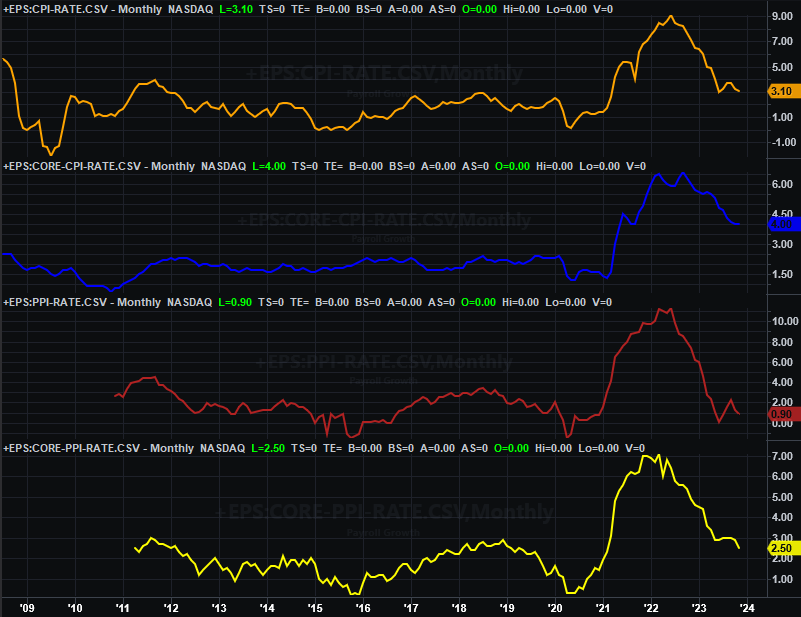 Source: Bureau of Labor Statistics, TradeStation Retail sales are pretty solid too, coming in much better than expected just by virtue of growing rather than contracting. Retail Sales Charts
 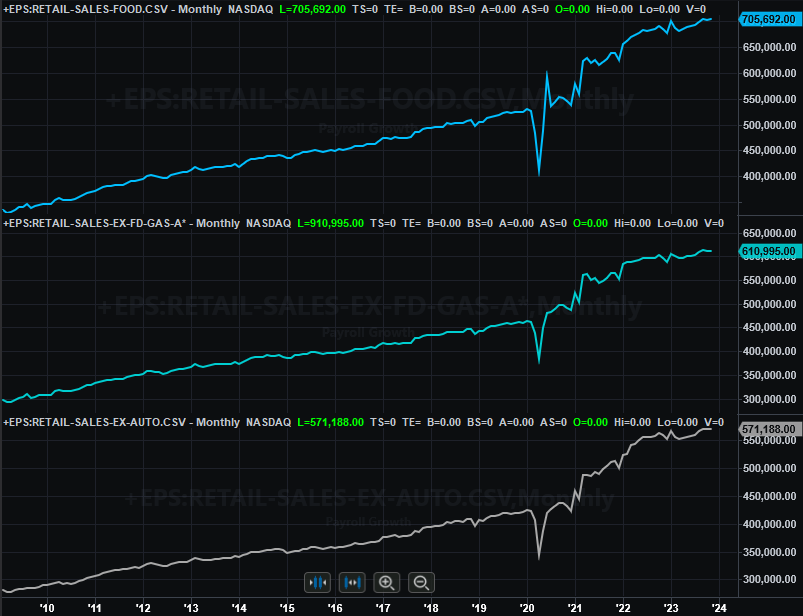 Source: Census Bureau, TradeStation Just as encouraging is November’s capacity utilization and industrial production. While utilization rates didn’t climb quite as much as hoped, it did climb, as did net production. Even these small improvements are welcomed resistance against what looks like budding bigger-picture downtrends. Industrial Productivity, Capacity Utilization Charts
 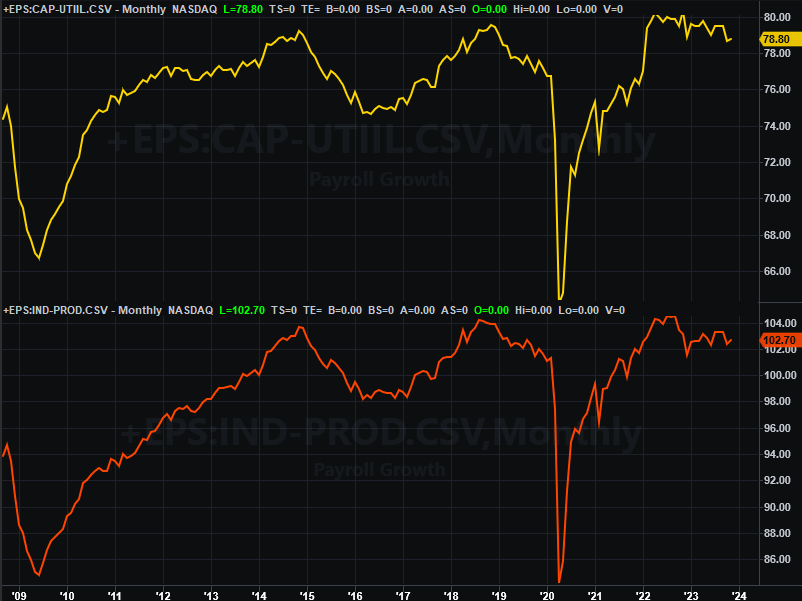 Source: Federal Reserve, TradeStation Everything else is on the grid. Economic Calendar
 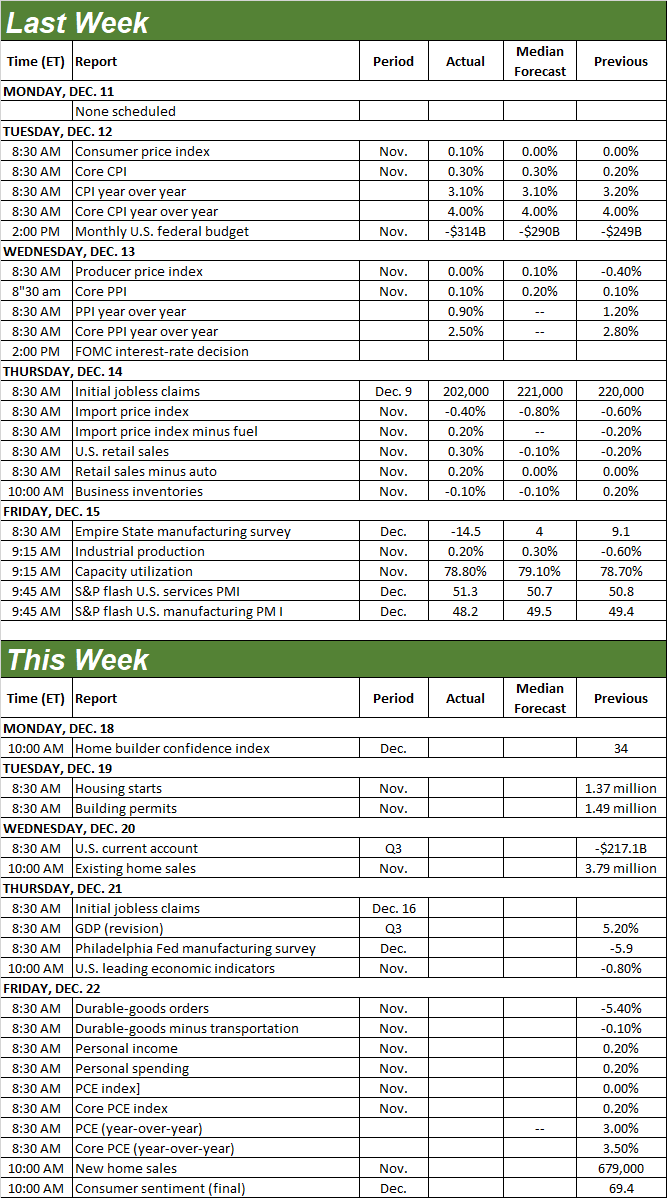 Source: Briefing.com This week’s going to be a rather big one, particularly for real estate numbers. Note that forecasts are not available for any of the coming week’s data, although we can still make an informed analysis of the data we do have and project some reasonable expectations. The party starts on Tuesday, with last month’s housing starts and building permits. These annualized numbers have been working hard to bounce back from last year’s lull. Between steep interest rates and tapped-out consumers though, we’re not looking for much (if any) meaningful forward progress here. Housing Starts and Building Permits Charts
 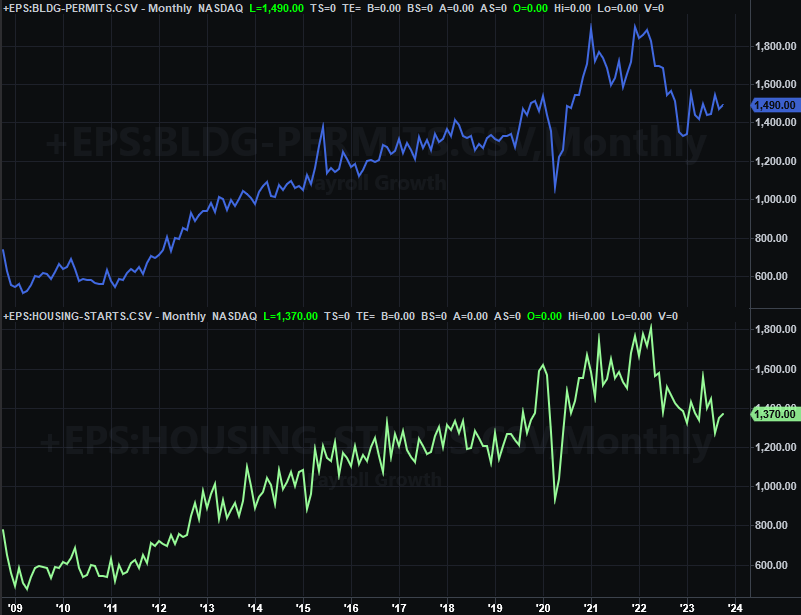 Source: Census Bureau, TradeStation On Wednesday look for last month’s sales of existing homes from the National Association of Realtors, followed by Friday’s report of November’s new homes sales. Neither has been especially thrilling of late. But, given the dire shortage of homes paired with so many people not interested in moving from the house they already live in, we’ve seen brief bursts of brilliance in new home sales of late. We should see some degree of continued strength on that front, even if it slips a little. That being said, note that homebuilder sentiment numbers will be posted on Monday. That may give is a glimpse of what to expect on Friday. Home Sales Charts
 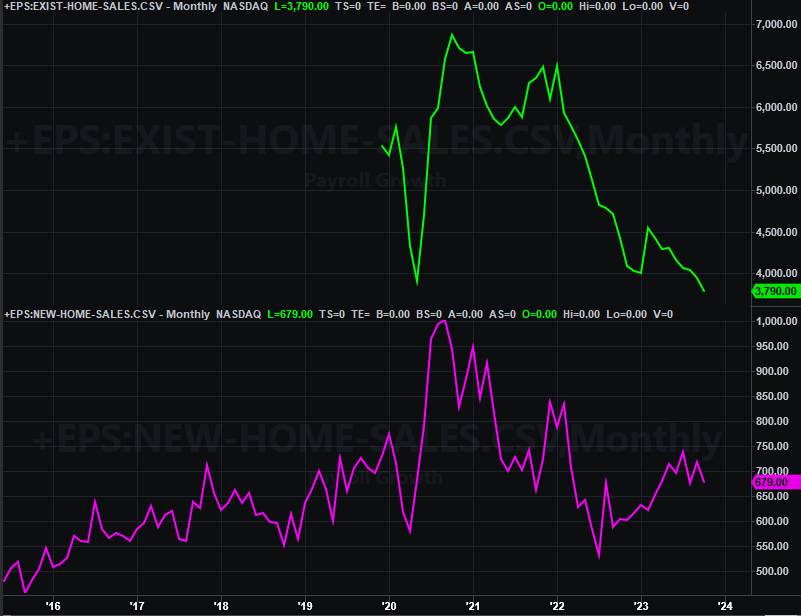 Source: National Association of Realtors, Census Bureau, TradeStation We’ll also get the final December figure for the University of Michigan’s sentiment index on Friday. Preliminary readings indicate a much higher reading than November’s score of 61.3, we can’t actually see sentiment is trending upward yet. Consumer Sentiment Charts
 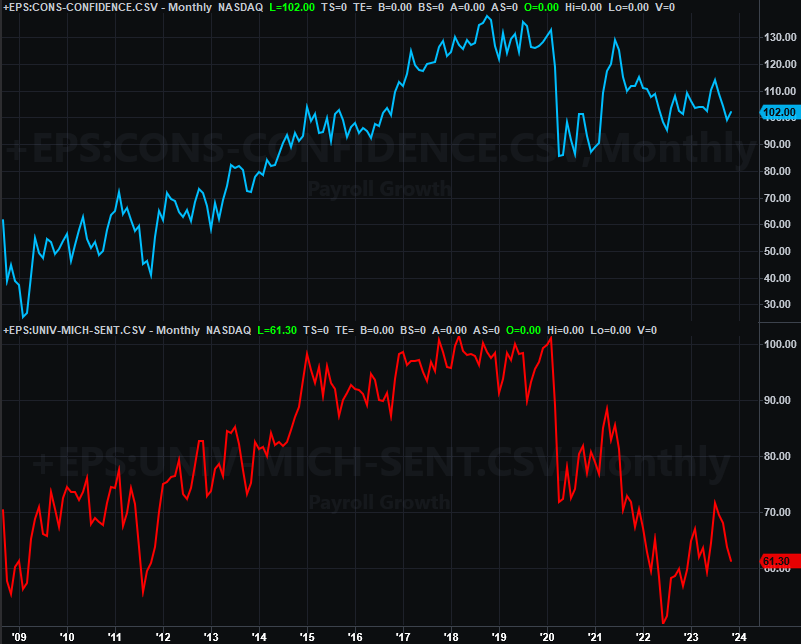 Source: National Association of Realtors, Census Bureau, TradeStation The Conference Board’s consumer confidence reading will be reported next week. As the chart above shows, its consumers are also largely on the fence right now. Also, although we’re not charting it here, note that we’ll get last month’s consumer income and expenditures numbers on Friday as well. It’s worth watching simply because the Federal Reserve pays more attention to these figures than it does inflation data when it comes time to make a decision regarding interest rates. Stock Market Index Analysis We’ll start this week with a look at the weekly chart of the Nasdaq Composite, since it alone tells us almost everything we need to know about the market right now. As we mentioned a week ago, the index had set up a cup-and-handle pattern with a brim line at 14,440. These are bullish provided the underling chart can actually break above the brim. Well, that happened, and it catapulted the composite. Nasdaq Composite Weekly Chart, with VXN and Volume
 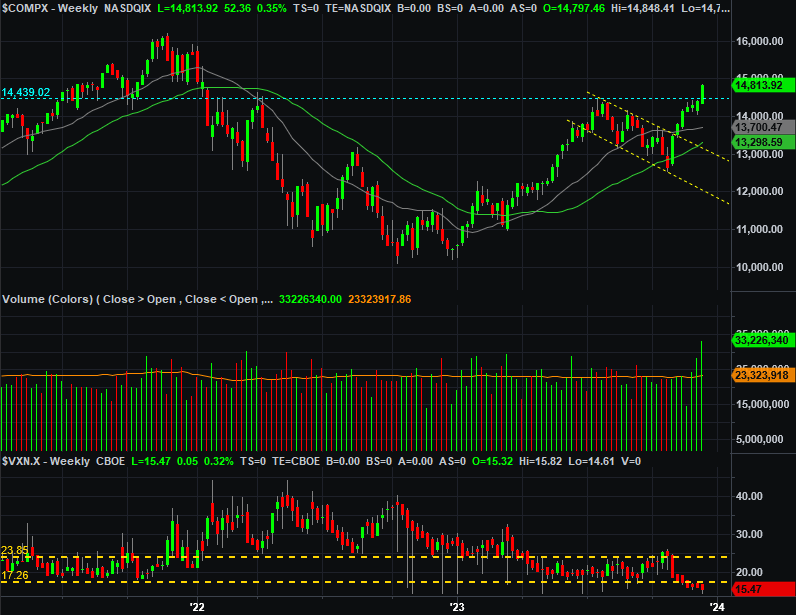 Source: TradeNavigator Here’s the daily chart of the Nasdaq Composite for a little added detail. Notice how last week’s gains were helped put into motion by the push up and off of the 20-day moving average line (blue) a week earlier; now the 20-day average is right around the cup-and-handle’s brim line as well. If and when the bears push back, don’t be surprised to see significant support at that level. Nasdaq Composite Daily Chart, with VXN and Volume
 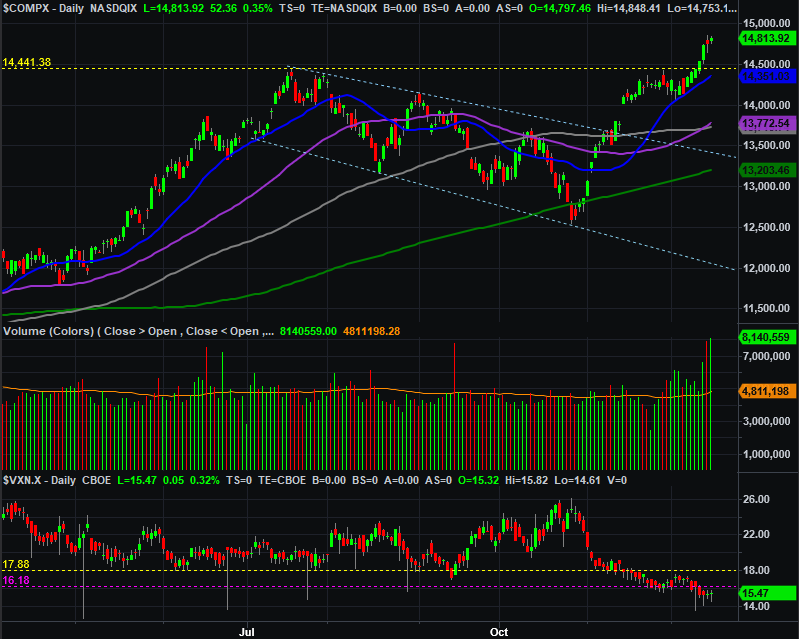 Source: TradeNavigator The swell of volume last week, by the way, is largely due to Friday’s option expiration. Not only was it an expiration day for the month and for the quarter, but for the year as well. A bunch of traders were forced to buy or sell if they want to begin the new year with a particular option position. It’s not particularly telling. The S&P 500 is going through the exact same process. That is, it completed a cup-and-handle pattern two weeks ago, and as of last week the brim line at 4,560 was broken, allowing the index to rally quite a bit. S&P 500 Weekly Chart, with VIX and Volume
 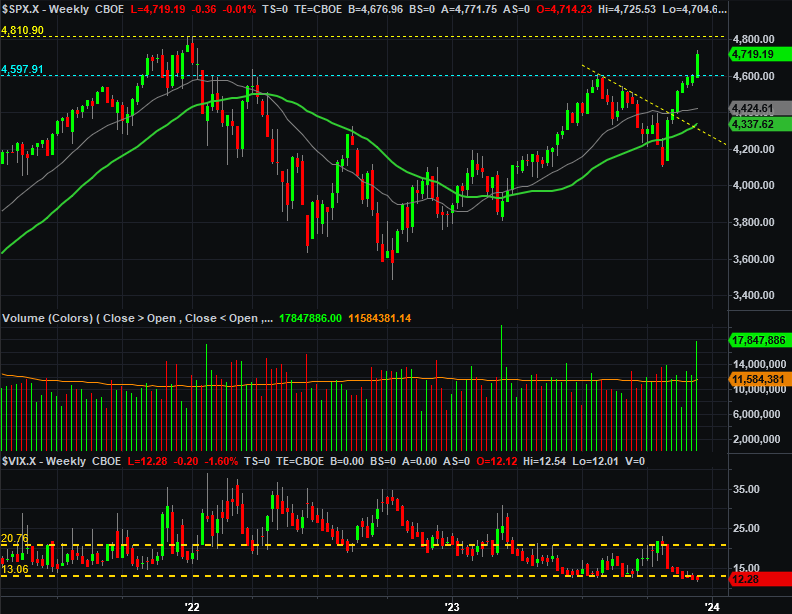 Source: TradeNavigator There is one potential problem ahead. That’s the 4,810 level (yellow, dashed) where the index peaked at the very end of last year. Traders may have some sort of psychological impasse at that point. Perhaps the bigger concern here, though, is the sheer scope of the rally since its late-October low. The S&P 500 has soared nearly 15% over the course of the past seven weeks. That’s a lot, and a tough act to follow (or add onto). In any case, here’s why we’re getting mixed messages right now. The last couple of weeks of the year are generally bullish, but there’s also usually a mid-month lull of just a few days. We started to see a lull late last week. But, the S&P 500 is wildly ahead of schedule this year. S&P 500 Cumulative Yearly Performance Chart (vs. Average)
 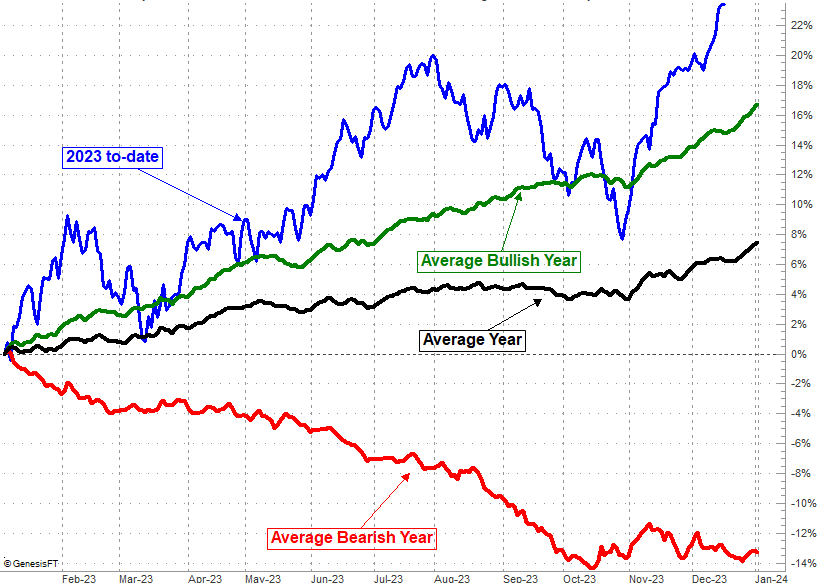 Source: TradeNavigator Don’t be surprised to see things level off for a few days this week. In fact, it would be surprising to not see that happen; the bulls need to regroup. After that though, the odds suggest more bullishness ahead into and through the beginning of the new year. Then we’ll have to reassess. The only thing that would really snap the rally is if the S&P 500 breaks under its 20-day moving average line, wherever it might be if-and-when it happens.More By This Author:Weekly Market Outlook – The Cup-And-Handle Pattern Is CompleteWeekly Market Outlook – The Gains Are Getting Tougher To MakeWeekly Market Outlook – Another Week, Another Win. But This Is Where Things Get Tough


Leave A Comment