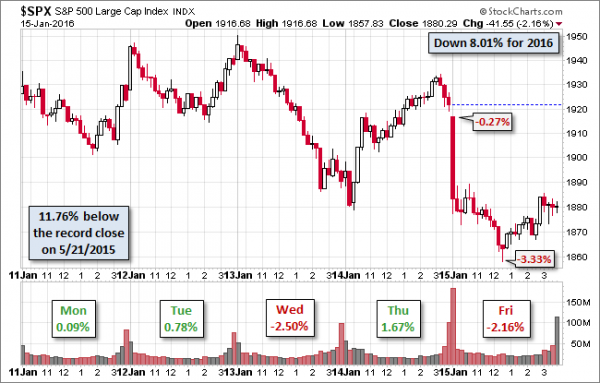
Stocks continued the worst start in history. With little sign of dip-buying and the start of earnings season, everyone will be wondering:
Can earnings reports provide a floor for stocks?
Prior Theme Recap
In my last WTWA I predicted that everyone would be wondering whether it was time to buy the dip – a strategy that had worked for years. That was a common question and the answer was a resounding, “No!” You can see the sad story for stocks from Doug Short’s weekly chart. (With the ever-increasing effects from foreign markets, you should also add Doug’s weekly chart to your reading list).

Doug’s update also provides multi-year context. See his weekly chart for more excellent charts and analysis.
We would all like to know the direction of the market in advance. Good luck with that! Second best is planning what to look for and how to react. That is the purpose of considering possible themes for the week ahead. You can make your own predictions in the comments.
This Week’s Theme
There are some economic reports this week, including the most important ones on housing. Despite this I expect a focus on corporate earnings, with a link to the stock market correction. Weak earnings reports will confirm fears, while positive reports may halt the market declines. Everyone will be wondering –
Can earnings season provide a floor for stocks?
Here are the key viewpoints:
Earnings do not matter. Current stock selling relates to (pick one or all):
- Excessive valuations
- Broken technical levels
- An inevitable recession
- A Chinese economic collapse and currency devaluation
- Emerging market stress
You can readily find proponents for each of these viewpoints.
As always, I have my own opinion in the conclusion. But first, let us do our regular update of the last week’s news and data. Readers, especially those new to this series, will benefit from reading the background information.
Last Week’s Data
Each week I break down events into good and bad. Often there is “ugly” and on rare occasion something really good. My working definition of “good” has two components:
The Good
Despite the extreme selling in stocks, there was a little good news last week.
High-yield debt stress remains contained to energy issues. This is a focal point of current concerns, with some asking if this is a replay of 2008 and subprime lending. Scott Grannis has both analysis and helpful charts.
Sharply lower oil prices have dramatically increased the risk of default for energy-related corporate debt, as shown in the blue line in the first chart above. But the threat of defaults is concentrated in the energy sector. Non-energy high-yield debt credit spreads are only 660 bps, much less than half the 1600 bps spreads on energy-related bonds, and less than the spreads on all HY debt at the peak of the PIIGS crisis. As the second chart above shows, swap spreads are very low, in sharp contrast to how they behaved in previous recessions. Very low swap spreads tell us that financial markets are highly liquid and that systemic risk is very low. This is mostly a problem affecting the oil patch, not everybody.
Markets today are far more liquid than they were in 2008 and 2011-12. That is of critical importance, and a source of comfort.


Leave A Comment