
Whilst August is generally a month of relaxation and rest, for the US indices it has been one of turmoil and tumult, signified with wild swings of collapse and recovery with the market swinging violently in a wide range. Long gone are the days of stately progress higher in measured and even paced steps, as a confluence of forces and sentiment drive risk back and forth almost on a daily basis.
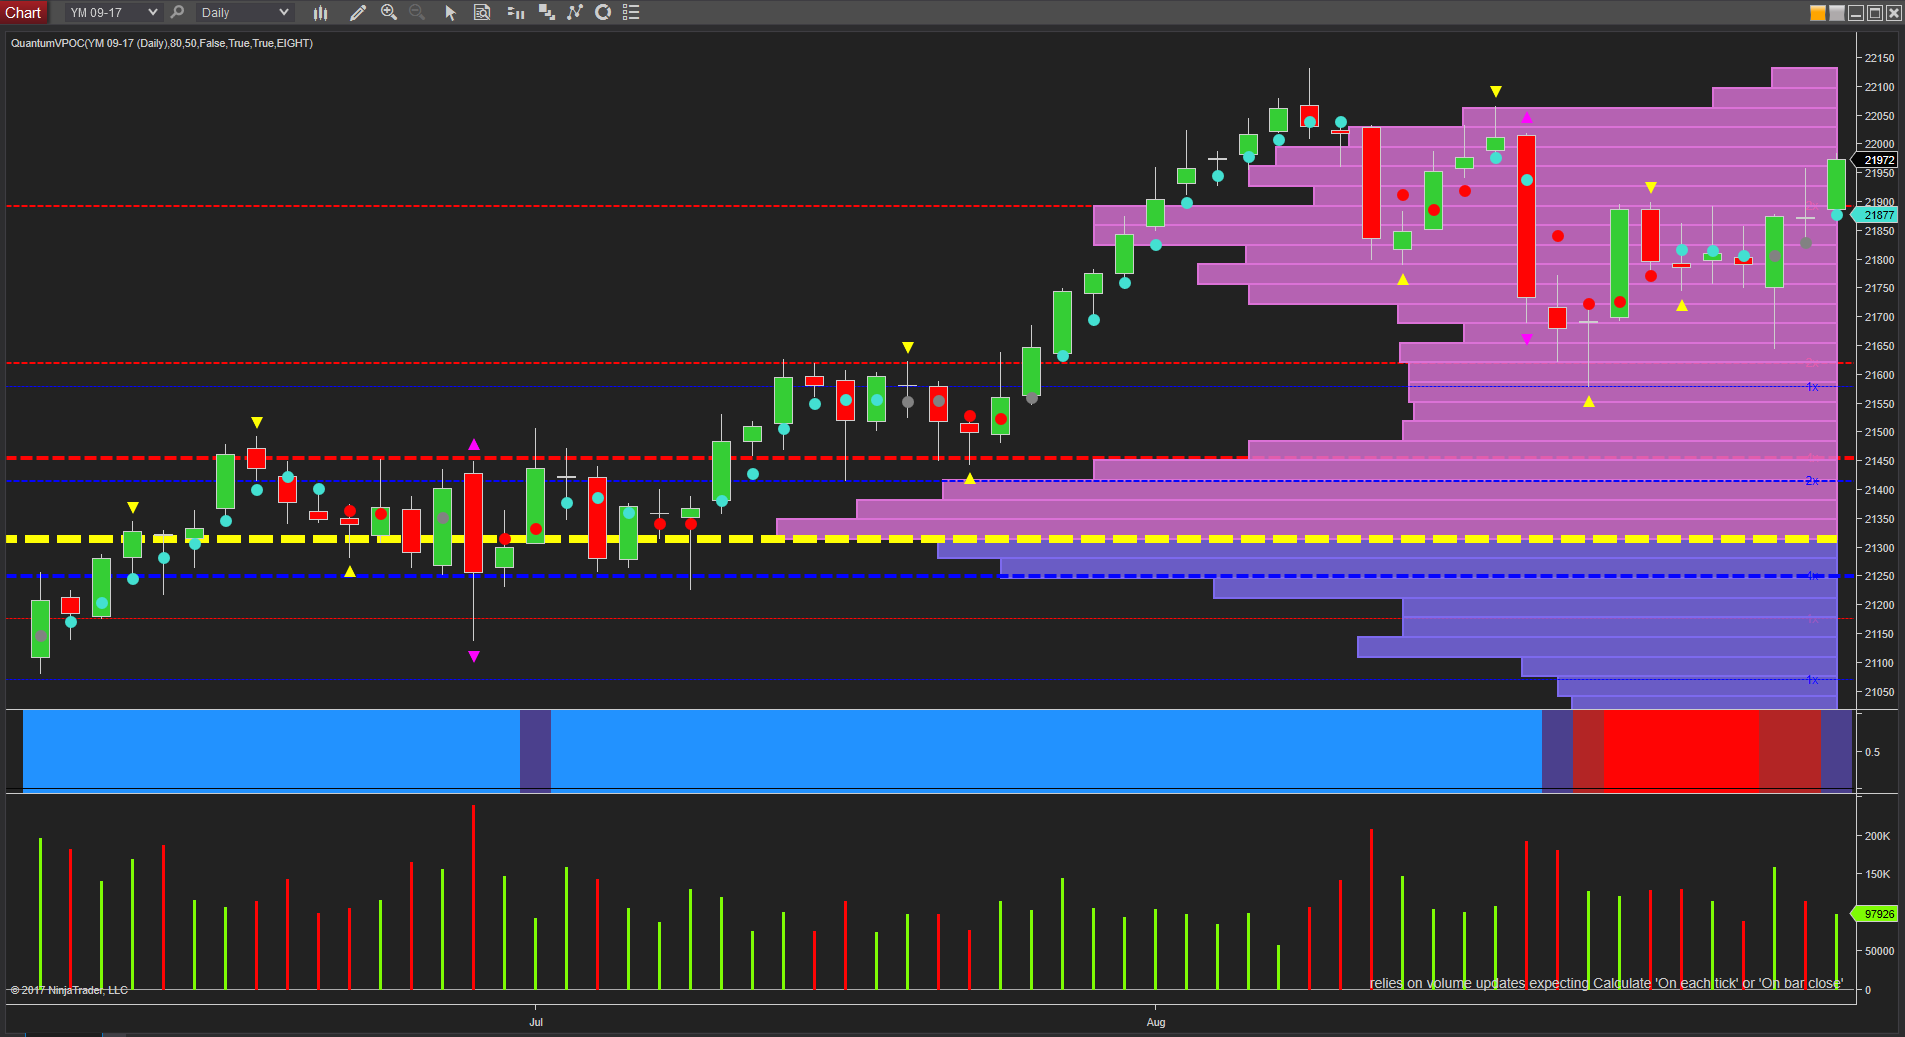
From a volume price perspective, the rally in late July into early August signaled an early warning of an exhausted market, with steadily rising prices associated with equally steadily falling volume. A classic anomaly, sending a clear and unequivocal signal of weakness ahead, and whilst seasonal declines in volume were certainly evident, volume in this period was declining rapidly and well below the average expected. Indeed, when the selling duly appeared, this was double any volume seen during the uptrend and followed by equally weak volume in the rally higher of mid-August. The wide spread down candle duly triggered a further bout of selling before a further attempt to rally followed, but again on weak volume, with yesterday’s candle signaling further weakness. The move higher in today’s session has been on low to average volume as the index struggled to reach the 22,000 level whilst continuing to trade within the spread of the volatility candle, denoted with the small violet triangles, top and bottom. So the question now, is where next for the US markets with Labor day now on the horizon, and a ‘return to work’ in early September?
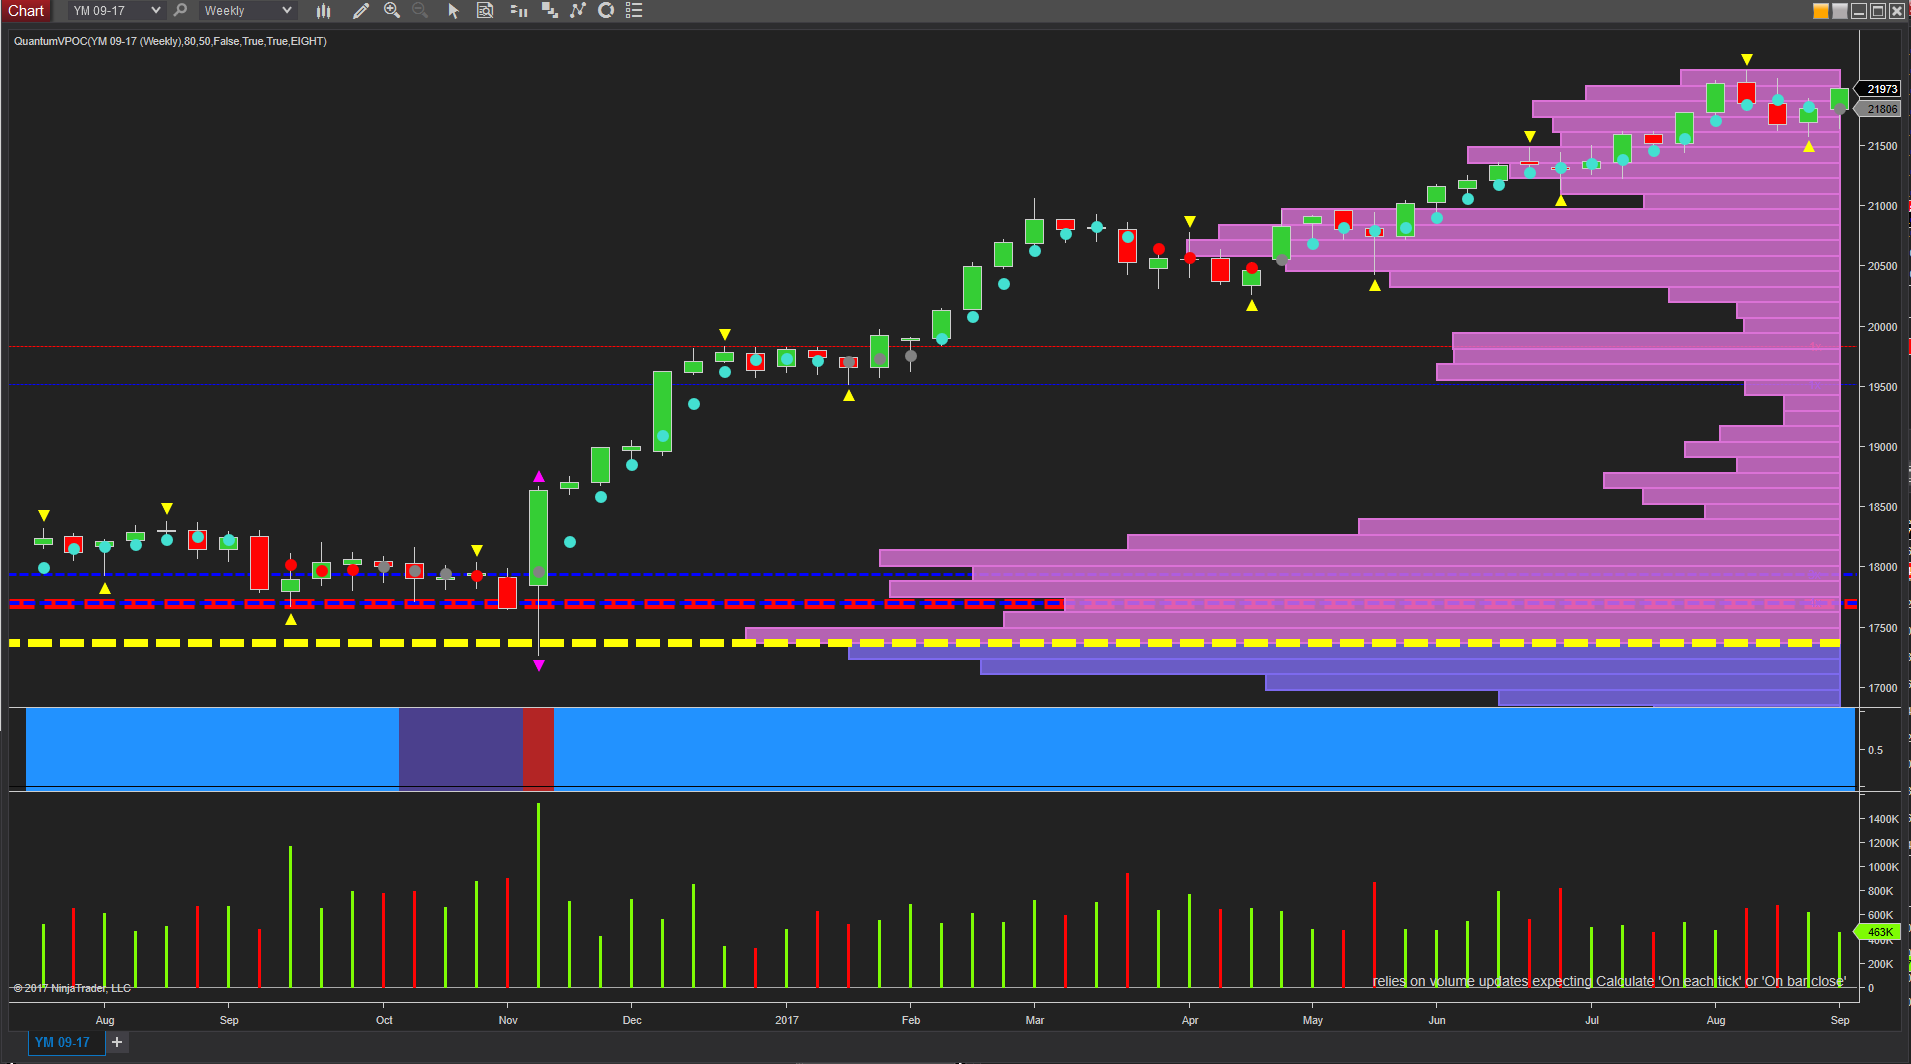
And to answer that particular question, it is perhaps easier to scale back from the daily chart to the weekly chart which provides a more balanced perspective, both of the volume and also the associated price action, and in doing so, the current wild swings seem less pronounced, and indeed almost measured when compared to some of the volatile weeks and wide spread candles of 2016. Indeed, what the weekly chart is signaling at present is a market in classic congestion phase, with the pivot to the upside marking setting the ceiling of resistance, and the pivot below defining the floor of support. A very different picture from the daily chart, and one which helps to provide a more balanced and smoothed view of the current picture, and here there is little to suggest we are approaching any sort of climatic top just yet. What we have seen is volatile price action which has been magnified by light seasonal volumes, but once volumes return to more normal levels next week, provided the ceiling now in place at 22,100 is breached on rising volume, the longer term bullish trend looks set to continue with the NQ emini leading the way higher once again as the YM emini follows in its wake. Indeed it is interesting to note that the NQ has already broken through its own ceiling of resistance, and is now waiting for the YM emini to follow suit!


Leave A Comment