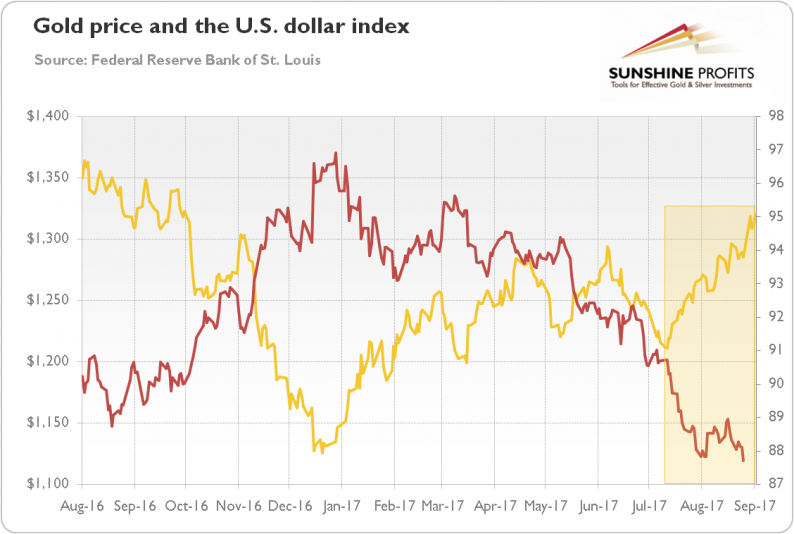
Since July 11, gold has been in a short-term upward trend. The yellow metal has gained more than 8 percent since then until the end of August, mainly thanks to the depreciation of the U.S. dollar, as one can see in the chart below.
Chart 1: Gold prices (yellow line, left axis, London P.M. fix) and the U.S. dollar index (red line, right axis, trade weighted index against major currencies).
The U.S. dollar index declined because of political turmoil in the Trump administration and the narrowing divergence between the U.S. and the Eurozone economy. Actually, the economic growth in the latter outpaced the former expansion in the first half of the year. The surprising economic performance in the euro area, with eased political uncertainty after Macron’s triumph in the French presidential elections, boosted the expectations of the ECB’s tightening. As a result, the EUR/USD exchange rate soared, which drove gold’s rally.
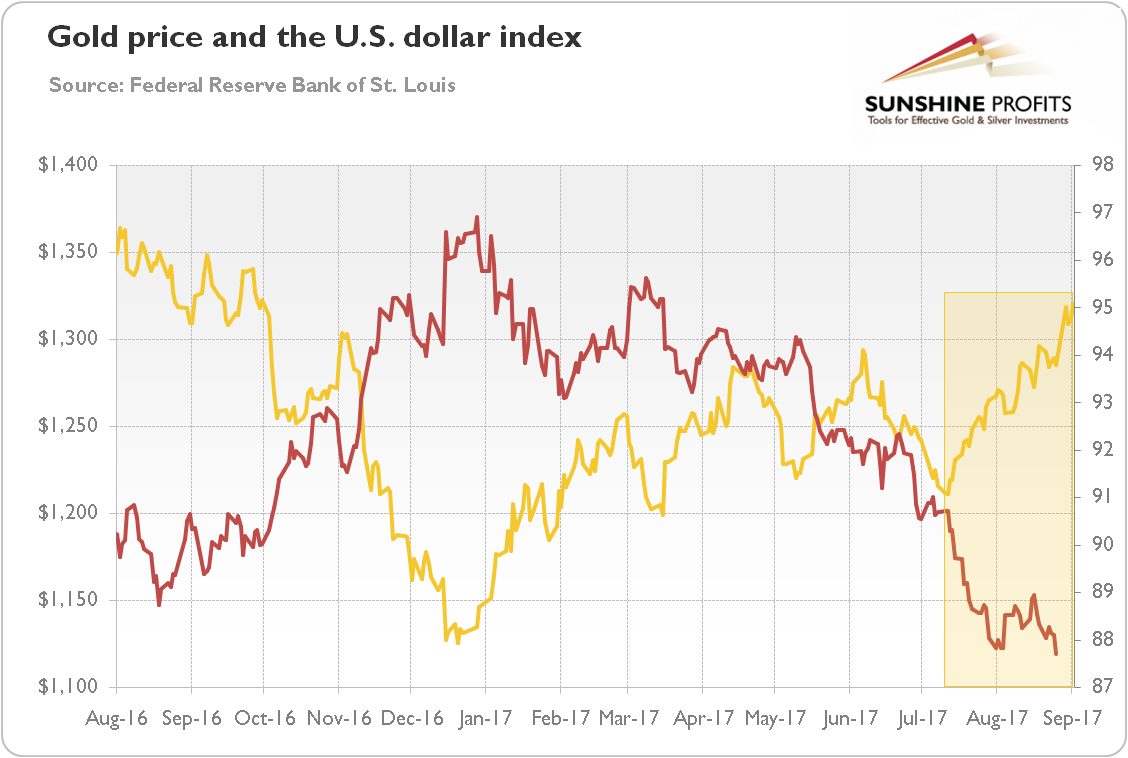
Another bullish factor in the analyzed period was the decrease in real interest rates due to softened expectations for the next hikes in the federal funds rate. As the next chart shows, real interest rates started to decline at the beginning of July, after the June FOMC minutes which were interpreted by markets as slightly dovish.
Chart 2: Gold prices (yellow line, left axis, P.M. London Fix) and the real interest rates (red line, right axis, yields on 10-year Treasury Inflation-Indexed Security, in %) over the last 12 months.
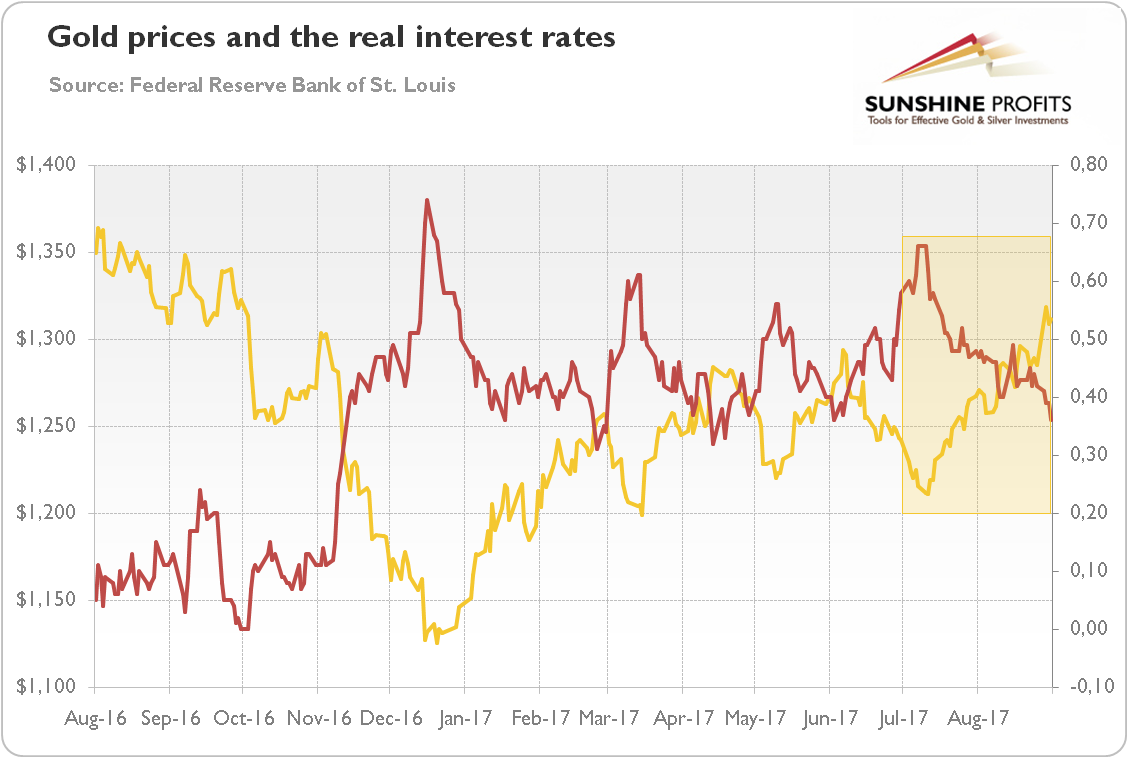
Last but not least, the risk premium increased in August. As one can see in the chart below, both the VIX Index and credit spreads rose in the first half of August, presumably due to the risk aversion fueled by geopolitical tensions due to North Korea.
Chart 3: The market volatility reflected by the CBOE Volatility Index (green line, right axis) and the credit spreads reflected by the BofA Merrill Lynch US High Yield-Option Adjusted Spread (red line, left axis, in %) over the last twelve months.


Leave A Comment