The Fed rate… What is going on with the Fed rate? The Fed say they would like to raise it in December. Others say they should wait.
Using an Effective Demand Version of the IS-LM curve
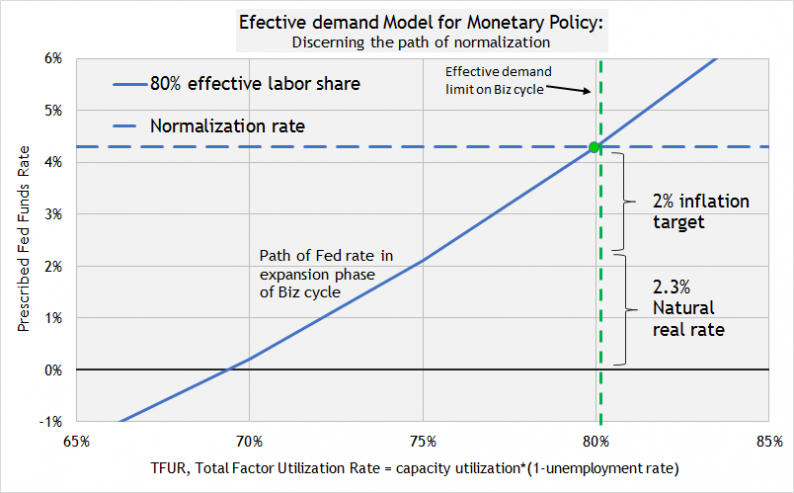
In a normal IS-LM model, the interest rate is on the y-axis and output on the x-axis. The following model will keep the interest rate on the y-axis, but put a measure for the utilization of labor and capital for output on the x-axis. The measure is TFUR which multiplies the capacity utilization rate by (1 – unemployment rate). This version of the IS-LM model makes it easier to compare business cycles.

The model shows that the Fed rate would normally rise as the business cycle expands and more labor and capital are utilized. Eventually the Fed rate will normalize at an interest rate equal to the inflation target + the natural real rate. According to this model, the normalization of the Fed rate will take place at the effective demand limit.
In the above model, the vertical dashed green line is the effective demand limit based upon an effective labor share of 80%. The effective demand limit is the projected labor share at full employment. (Labor share is calculated by labor share index: non-farm business * 0.762) The effective demand limit is the limit that the TFUR utilization of labor and capital will reach at full employment.
The Model before the Crisis
This graph adds actual data from 1stQ 2002 to the present.
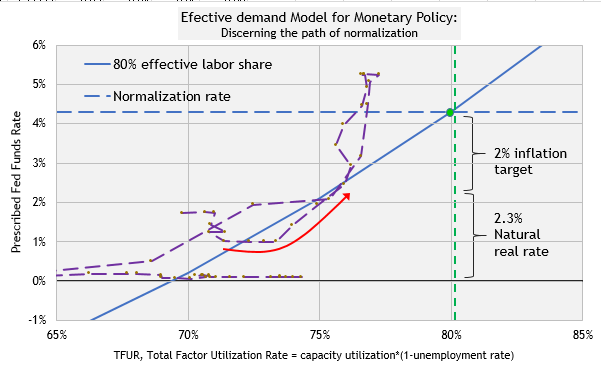
As the expansion ensued after the 2001 recession, labor share was around 80%. The curving red arrow shows how the Fed rate was moving along a path associated with an 80% effective labor share, 2% inflation target and an estimated natural real rate of 2.3%.
The Fed rate was heading toward normalization at 4.3%. But then something unusual happened during the expansion. Labor share fell quickly to 77.3%. Effective labor share had never fallen to that level before. The up-sloping path shifted left.
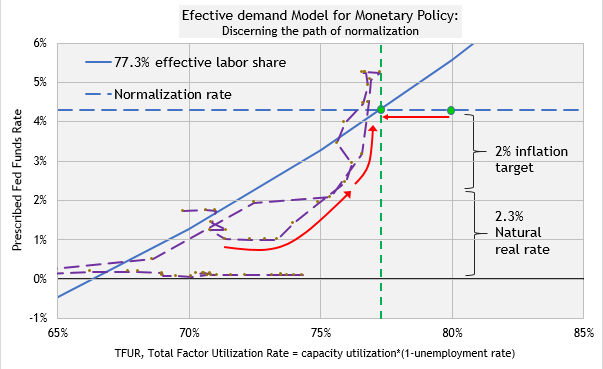
All of a sudden, the Fed rate was too low according to the prescribed path. Was the Fed surprised by the changes it began to see in the economy? I think so… The Fed rate appeared to rise faster toward the new green dot of normalization but really utilization of labor capital were slowing down. Imbalances in core inflation and bubbles were developing. Ultimately, the Fed rate rose above the normalization rate of 4.3% to control inflation pressures and bubble imbalances.


Leave A Comment