
The multi-day trend for silver prices remains bullish above last week’s low of $15.21 and prices may reach last week’s high of $16.16, followed by the October 15, 2015 high of $16.24.
Traders who are not long and would like to take advantage of the trend might wait for a pullback to the $15.79 – $15.57 range. Here price would be neutral in relation to the bullish trend and may encourage traders to turn bullish. The range is derived using Fibonacci retracement and a mixture of last week’s low of $15.21 and last week’s high of $16.16. Both are used as points of reference here.
To date, price reached this range in yesterday’s session, but we can’t rule out another test of the range.
On a break to last week’s high of $16.16, we may see a test to the October 15, 2015 high of $16.24, followed by the June 18, 2015 high of $16.49.
For the trend to turn bearish, price would need to slide below and break last week’s low of $15.21.
Markit U.S. manufacturing PMI is on deck today and is seen at 51.9 from 51.3 according to a Bloomberg news survey. A very strong beat to the expected figure may strengthen the Dollar and soften silver, with the opposite also being true.
Silver Price | FXCM: XAG/USD
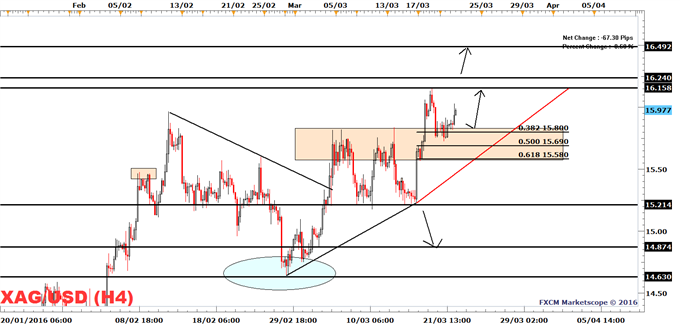
Created with Marketscope/Trading Station II; prepared by Alejandro Zambrano


Leave A Comment