
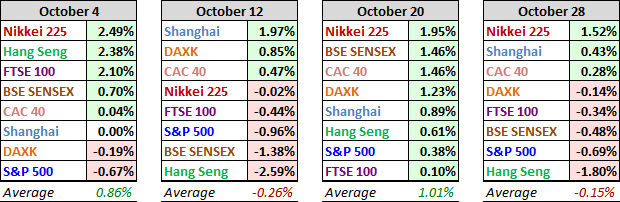
The past week was a mixed bag for our global watch list of eight indexes, with three posting gains and five posting losses. The average of the eight was a fractional loss of 0.15%. Japan’s Nikkei was the top performer for the second week, up 1.52% following the previous week’s 1.95%. Its neighbor the Hang Seng was the biggest loser, down 1.80%.
The Last Four Weeks
The tables below provide a concise overview of performance comparisons over the last four weeks for these eight major indexes. We’ve also included the average for each week so that we can evaluate the performance of a specific index relative to the overall mean and better understand weekly volatility. The colors for each index name help us visualize the comparative performance over time.
Year-to-Date Performance
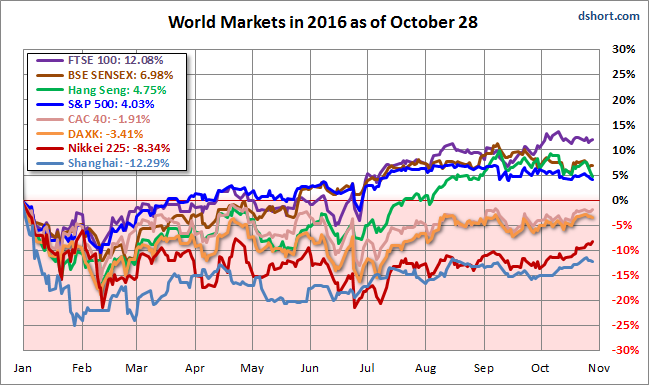
Here is an overlay of the eight illustrating their comparative performance so far in 2016.
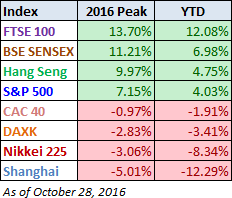
Here is a table of the 2016 performance, sorted from high to low, along with the most recent highs for the eight indexes. Four indexes are in the green year-to-date, unchanged from last week. The UK’s FTSE is the top performer, by about 5%, the plunge in the Pound a key factor. China’s Shanghai remains in the distant cellar.
Bear Market Perspective
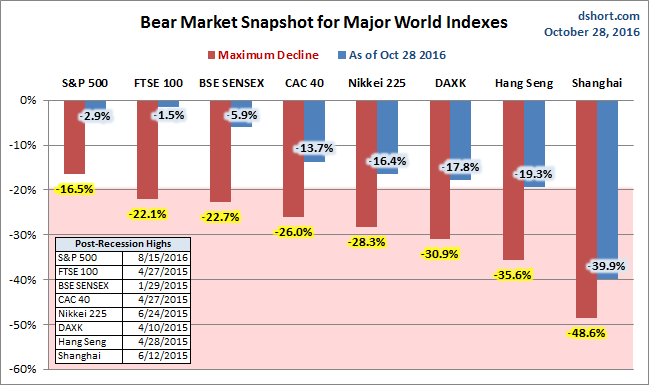
The column chart is sorted by the least to worst declines from previous peaks as of the week’s end. Seven of our eight watch list indexes had dropped into bear territory (a 20% decline), the S&P 500 being the sole exception. As of the latest close, Shanghai Composite remains deep in the bear zone. The Nikkei had been zigzagging in and out of over the past several weeks, but its surge over the past two weeks gives the Nikkei some welcome space above the bear line. The Hang Seng’s bad week puts it less than a percent from a return to the bear zone.
A Longer Perspective
The chart below illustrates the comparative performance of World Markets since March 9, 2009. The start date is arbitrary: The S&P 500, CAC 40 and BSE SENSEX hit their lows on March 9th, the Nikkei 225 on March 10th, the DAX on March 6th, the FTSE on March 3rd, the Shanghai Composite on November 4, 2008, and the Hang Seng even earlier on October 27, 2008. However, by aligning on the same day and using a log scale vertical axis, we get an excellent visualization of the relative performance. We’ve indexed each of the eight to 800 on the March 9th start date. The callout in the upper left corner shows the percent change from the start date to the latest weekly close.


Leave A Comment