

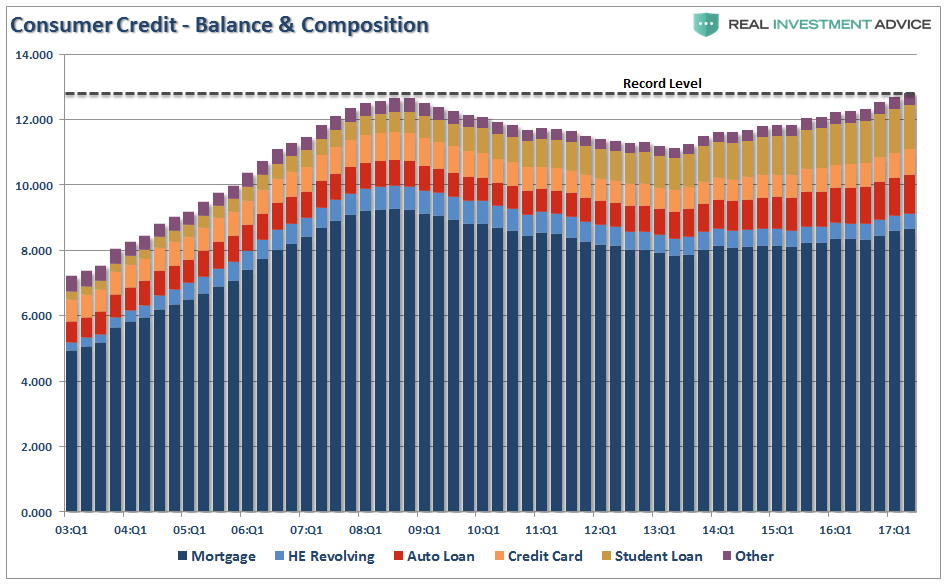
Just recently the Federal Reserve Bank of New York released its quarterly survey of the composition and balances of consumer debt. Importantly, it was the fact that total indebtedness reached a new all-time record that sent the mainstream media abuzz with questions about the economic implications. Here is the graphic that accompanied the commentary.
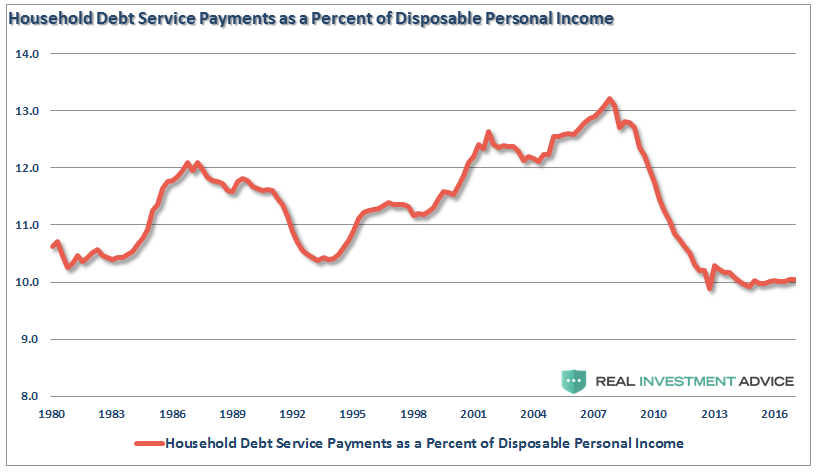
One of the more interesting points made, in order to support the bullish narrative, was that record levels of debt is irrelevant because of the rise in disposable personal incomes. The following chart was given as evidence to support that claim.
Looks pretty good, as long as you don’t scratch too deeply. Let’s scratch a little.
There are several problems with this analysis.
First, the calculation of disposable personal income, income less taxes, is largely a guess and very inaccurate due to the variability of income taxes paid by households.
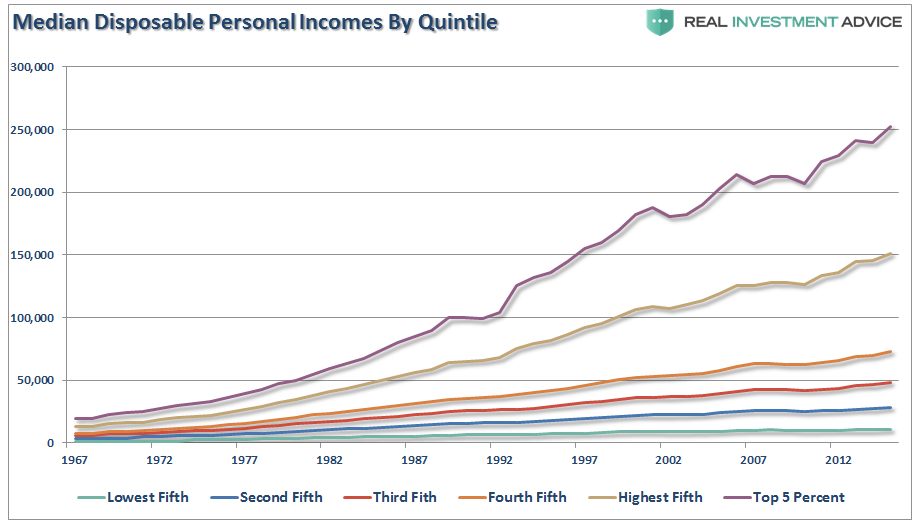
Secondly, but most importantly, the measure is heavily skewed by the top 20% of income earners, needless to say, the top 5%. As shown in the chart below, those in the top 20% have seen substantially larger median wage growth versus the bottom 80%.
(Note: all data used below is from the Census Bureau and the IRS.)
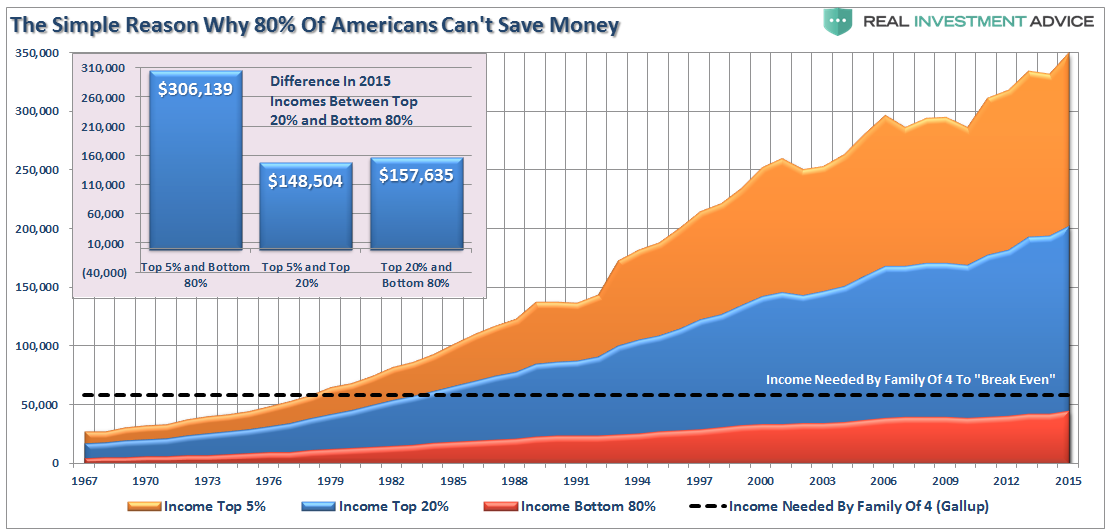
Lastly, disposable incomes and discretionary incomes are two very different animals. Discretionary income is what is left of disposable incomes after you pay for all of the mandatory spending like rent, food, utilities, health care premiums, insurance, etc. According to a Gallup survey, it requires about $53,000 a year to maintain a family of four in the United States. For 80% of Americans, this is a problem even on a GROSS income basis.
This is why record levels of consumer debt is a problem. There is simply a limit to how much “debt” each household can carry even at historically low interest rates.
It is also the primary reason why we can not have a replay of the 1980-90’s.


Leave A Comment