
 Image Source: Pixabay
The EUR/USD currency pairTechnical indicators of the currency pair:
The euro has surpassed the 1.1 USD mark by the end of 2023, having gained almost 4% over the year. The euro has rallied in recent weeks on expectations that the Federal Reserve (Fed) will start cutting rates sooner than the European Central Bank (ECB). The US dollar recovered from a 5-month low on Thursday and posted moderate gains. EUR/USD on Thursday initially moved up on hawkish comments from ECB Governing Council representative Holtzman, who said that it was too early for the ECB to think about cutting interest rates now. But then, the growth of the dollar caused pressure on the euro from liquidations of long positions.Trading recommendations
The trend on the EUR/USD currency pair on the hourly time frame is bullish. Yesterday, the price reached an important resistance level at 1.1117, where sellers showed a reaction. The MACD indicator still shows divergence, with the price trading at the level of the moving averages. Under such market conditions, buy trades can be considered from the support level of 1.1058 but are subject to buyers’ reaction. A breakdown of 1.1058 will open the way for the price to 1.1010. Selling can be sought from the resistance level of 1.1097, but also with confirmation and short targets, as these will be positions against the main trend.Alternative scenario: if the price breaks the support level at 1.0928 and consolidates above it, the downtrend will likely resume. 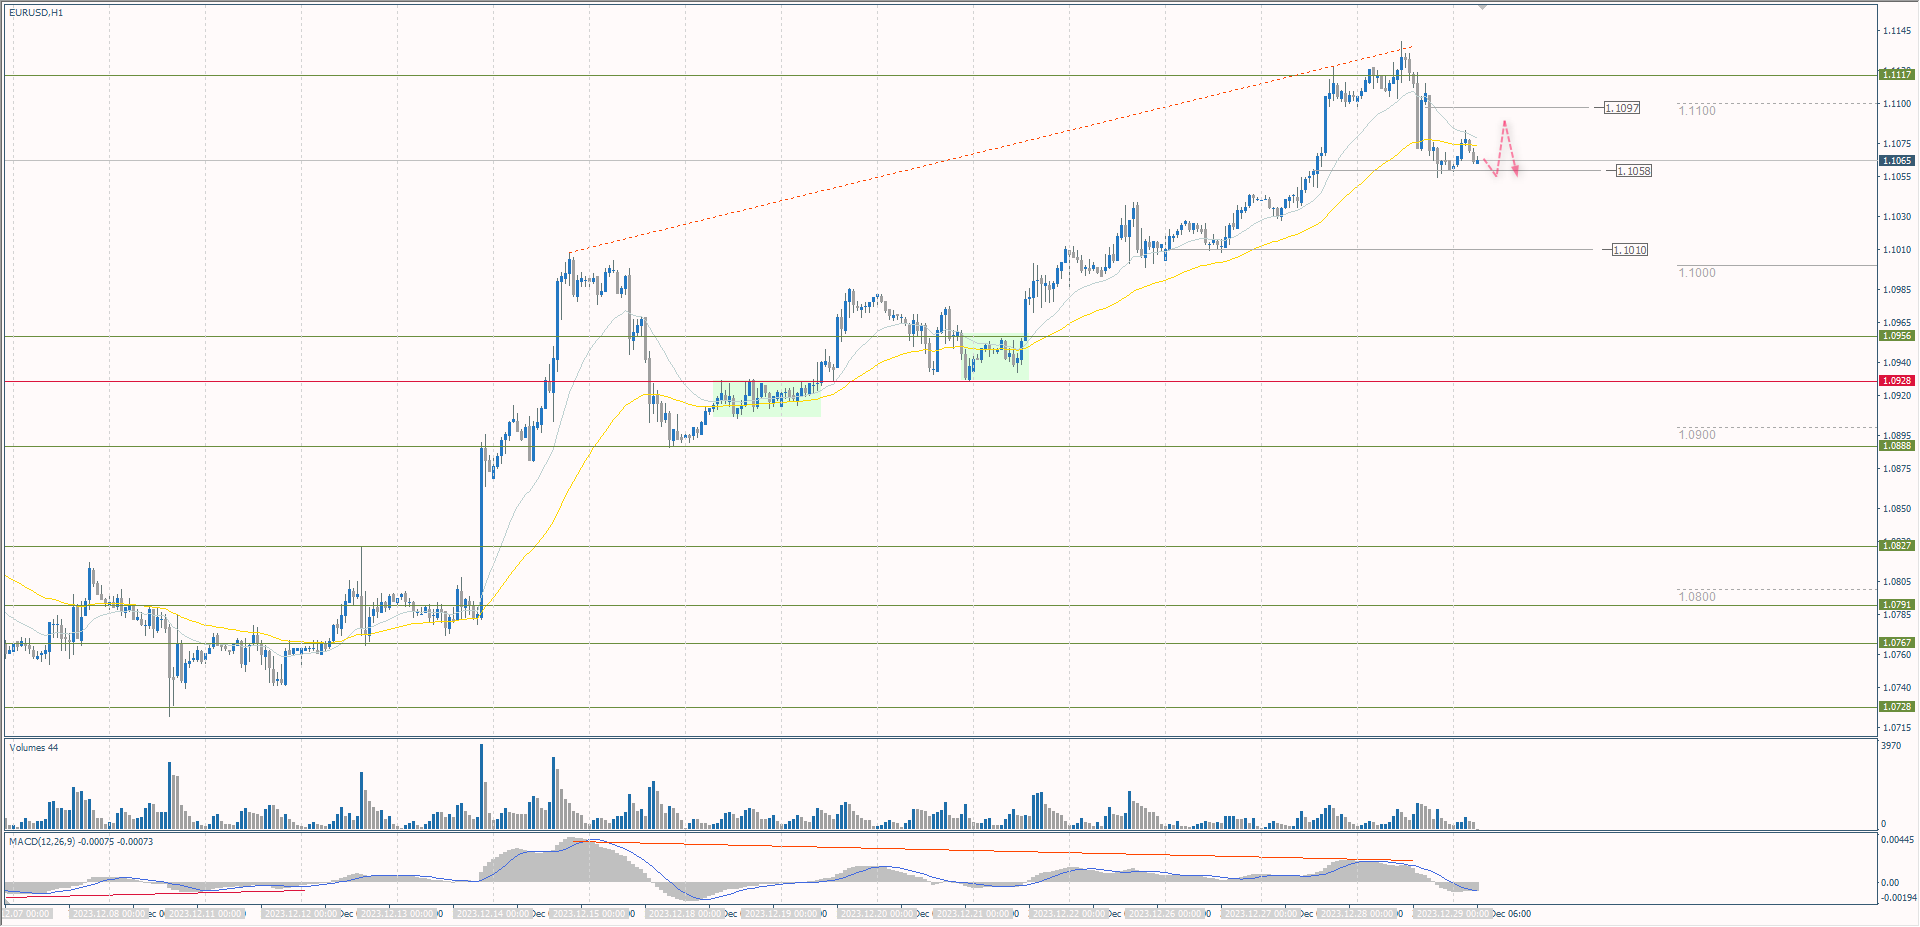 News feed for 2023.12.29:
The GBP/USD currency pairTechnical indicators of the currency pair:
The British Pound Sterling rose to $1.28 by the end of 2023, reaching its highest level since the end of July, showing a nearly 6% gain for the year. Recent data showing an unexpected drop in US goods and services prices has significantly increased the likelihood of a Fed rate cut as early as next March, causing the dollar to fall, which the pound took advantage of. The UK stock exchange has a short trading day today, so volatility on the GBP/USD currency pair will mostly be provided by the US dollar. Today is also the last trading day of the year, so the activity will be weak.Trading recommendations
From the point of view of technical analysis, the trend on the GBP/USD currency pair on the hourly time frame is bullish. Yesterday, the price reached the resistance level of 1.2808, where sellers showed a reaction. A corrective wave has started. Buying is best sought on intraday time frames from the support level of 1.2694 but with confirmation. For sell deals, we can consider the 1.2753 resistance level, provided the sellers react accordingly.Alternative scenario: if the price breaks the support level at 1.2682 and consolidates below, the downtrend will likely resume. 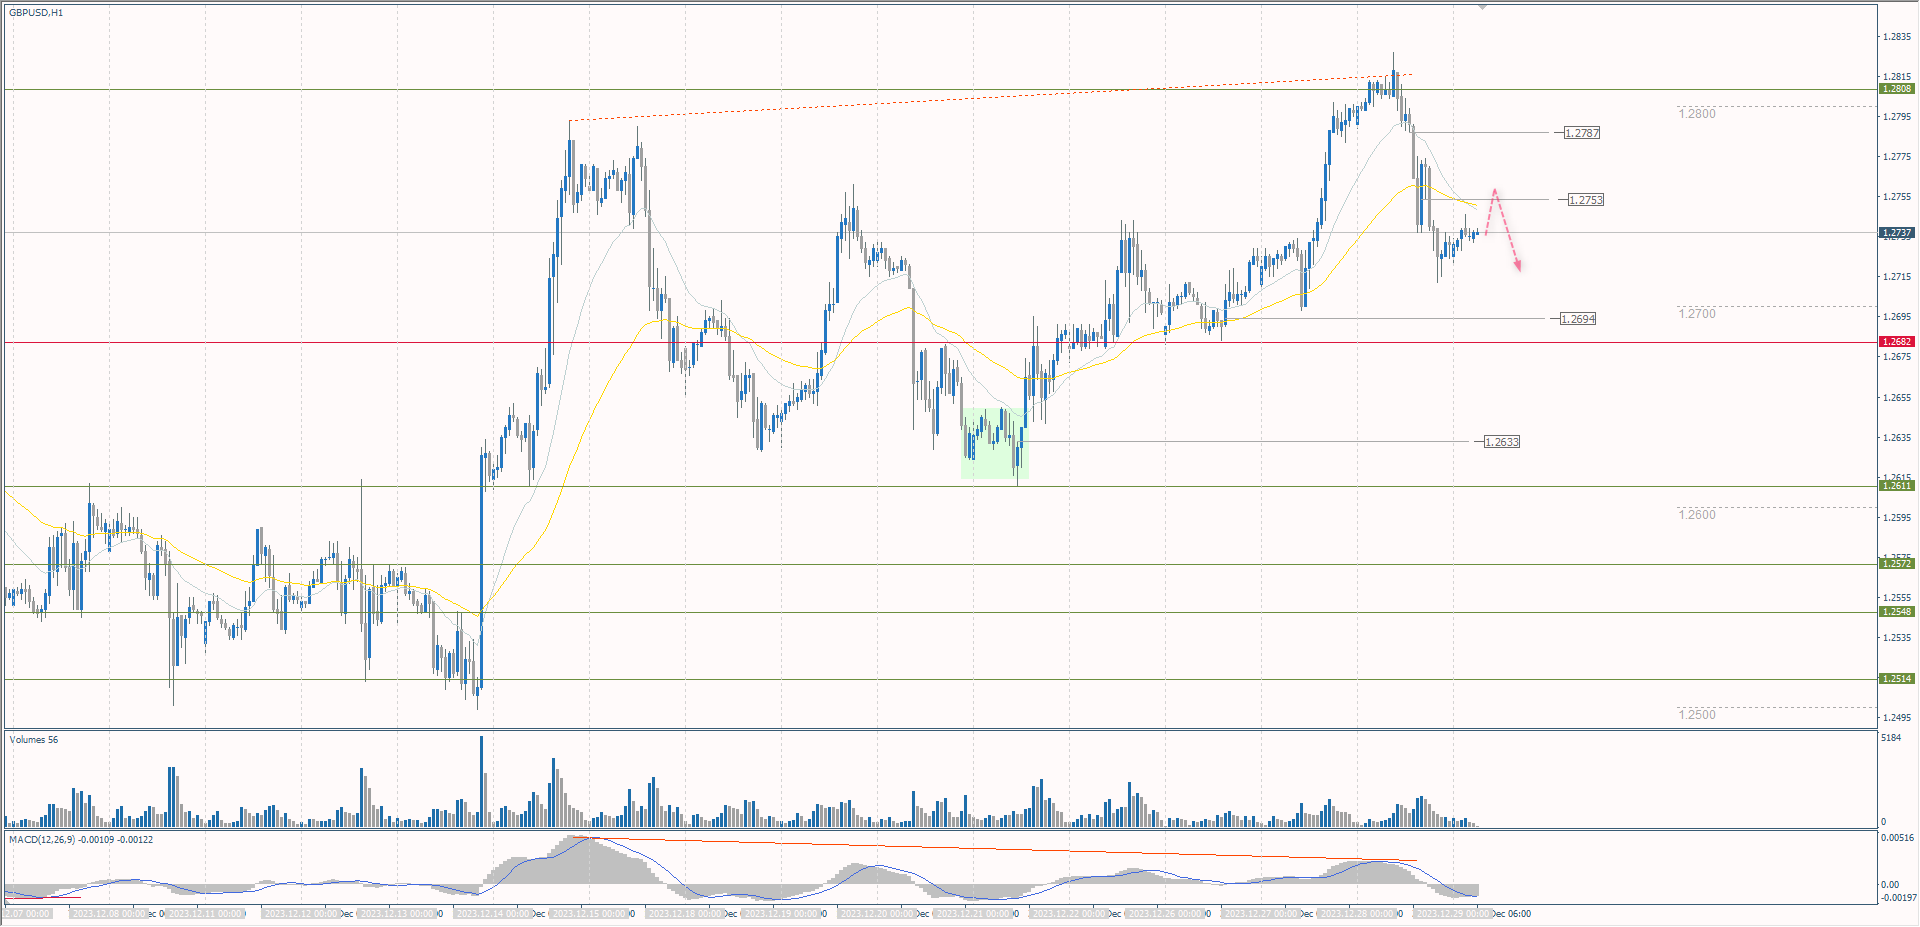 There is no news feed for today.
The USD/JPY currency pairTechnical indicators of the currency pair:
The Japanese yen rose to a 5-month high against the dollar on Thursday. The yen found support Thursday on hawkish comments from Bank of Japan (BoJ) Governor Ueda, suggesting he is preparing markets for a rate hike in the spring. Ueda said it’s possible the BoJ could exit its negative rate policy at its April meeting after assessing annual wage data due in March. In addition, positive Japanese economic news on Thursday on industrial production and retail sales were bullish for the yen.Trading recommendations
From the technical point of view, the medium-term trend on the currency pair USD/JPY is bearish. The price has reached a strong support zone of the higher time frame. There is a reaction of buyers. But for the reversal, it is necessary to see the breakout of resistance levels. Under such market conditions, sell deals can be sought from the resistance level of 141.75 or 142.45, provided sellers take the initiative on the lower time frames. Buying should be looked for from the support level of 140.95, but also on the condition of reaction from buyers, as the level has already been tested. A breakdown of 140.95 will open the way to 140.07.Alternative scenario: if the price consolidates above the resistance level of 144.96, the uptrend will likely resume. 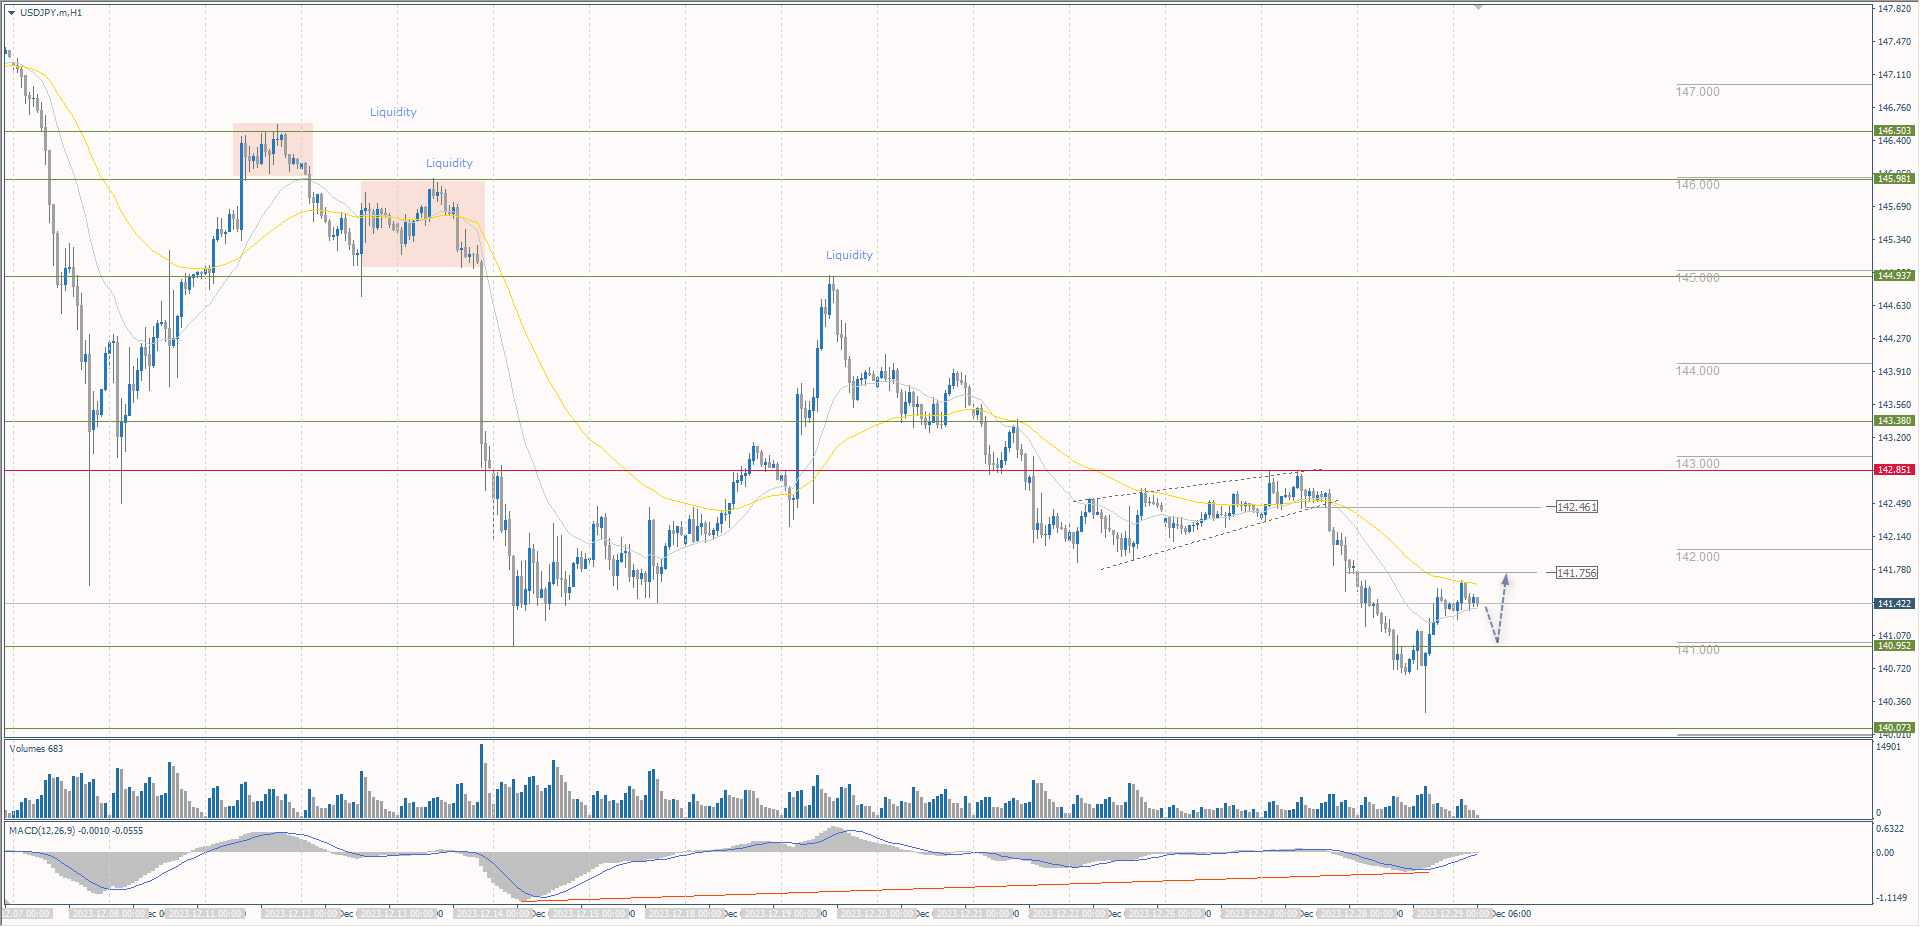 There is no news feed for today.
The XAU/USD currency pair (gold)Technical indicators of the currency pair:
Gold has gained more than 14% this year, the first annual gain since 2020. In addition to hopes of monetary easing, wars in Ukraine and Gaza, as well as broader geopolitical tensions in the Middle East, have boosted demand for the metal. Gold is expected to rise further next year amid interest rate cuts by global central banks.Trading recommendations
From the point of view of technical analysis, the trend on the XAU/USD is bullish. The MACD indicator is still pointing to divergence, so the probability of a deeper correction is high. The support level of 2060 can be considered as support for further growth, but the price may be correct to 2045. Going below 2045 is undesirable for buyers. Selling can be looked for from the resistance level 2072 or 2084, but only with confirmation. Intraday selling should be done only with short targets, as these will be positions against the main trend.Alternative scenario: if the price breaks below the support level of 2015, the downtrend will likely resume. 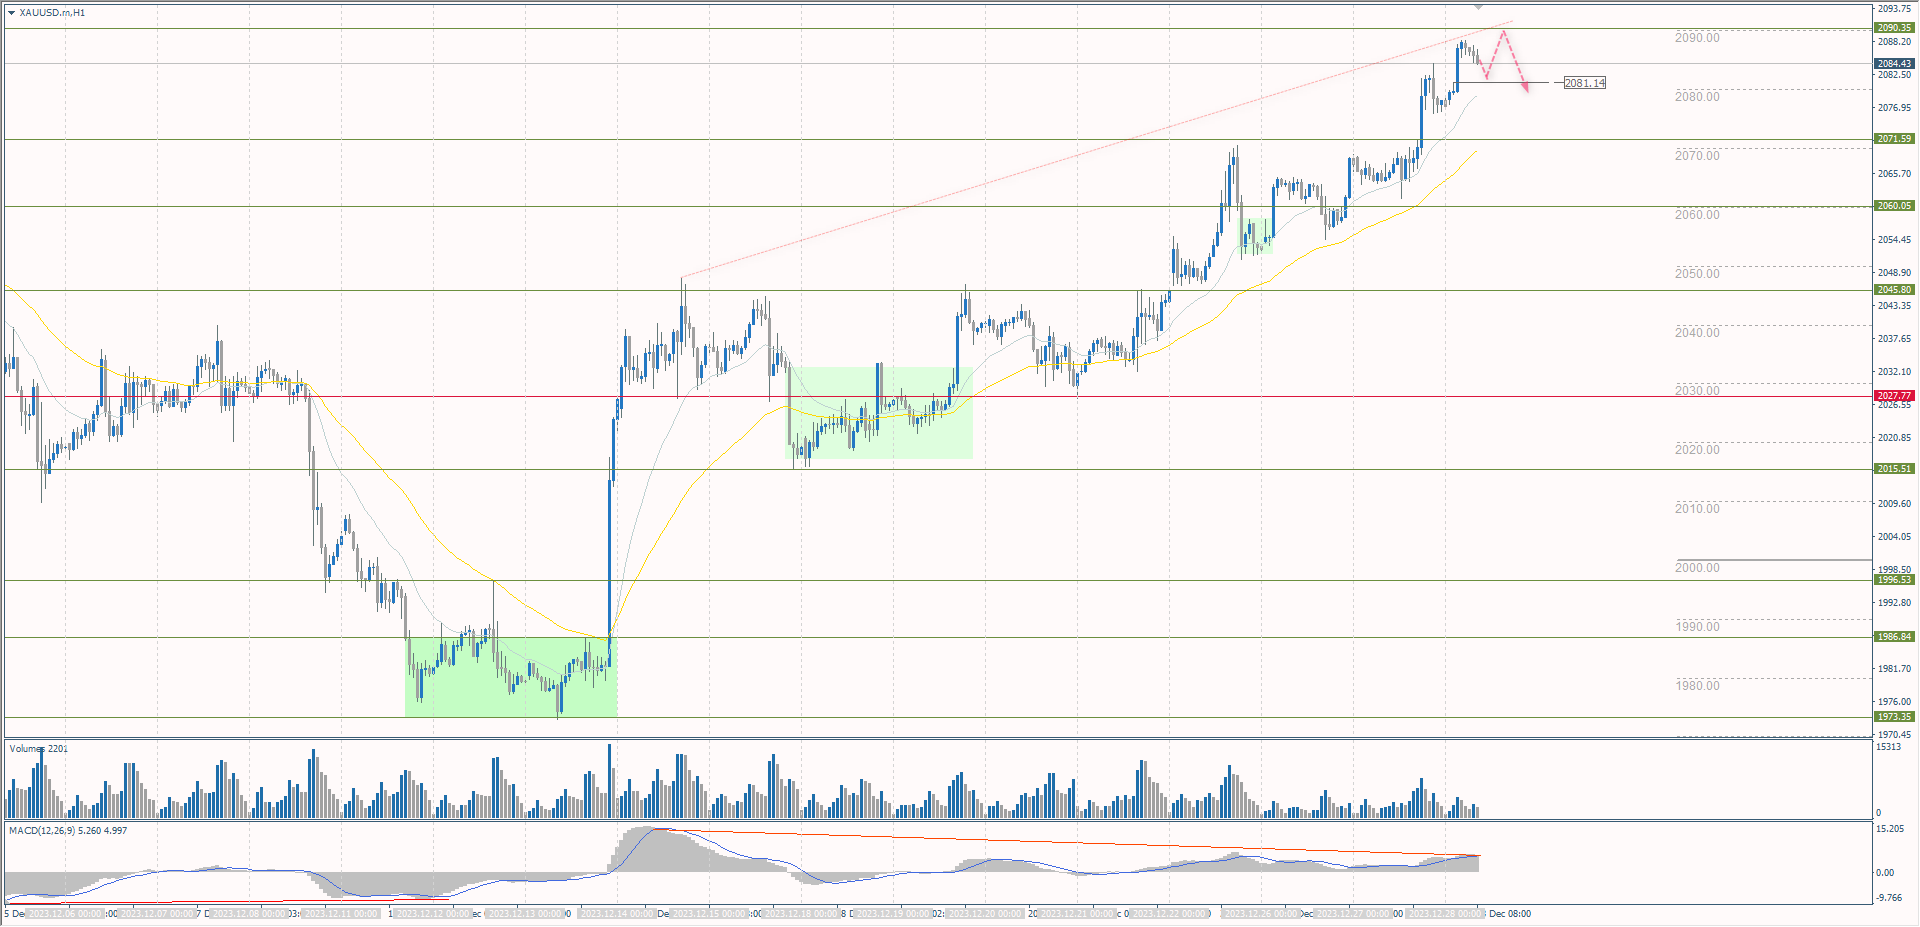 News feed for 2023.12.29:
More By This Author:Japanese Index Became The Best-Performing Stock Index In Asia Analytical Overview Of The Main Currency Pairs – Thursday, Dec. 28 The Decline In Global Bond Yields Supports Stock Indices


Leave A Comment