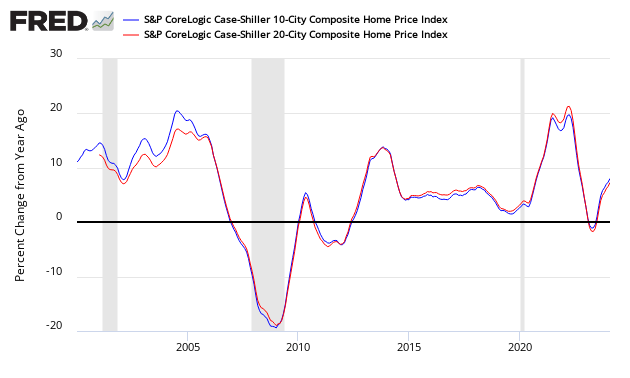
The non-seasonally adjusted Case-Shiller home price index (20 cities) year-over-year rate of home price growth grew from 5.8 % to 5.9%. The index authors stated “Home price increases appear to be unstoppable …. Most prices across the rest of the economy are barely moving compared to housing.”

Analyst Opinion of Case-Shiller HPI
Many pundits believe home prices are back in a bubble. Maybe, but the falling inventory of homes for sale keeps home prices relatively high. I continue to see this a situation of supply and demand. It is the affordability of the homes which is becoming an issue for the lower segments of consumers. It should be noted that the rate of year-over-year increased peaked in February 2017 at 5.92 %, and has declined every month since until this month and is currently at 5.92 %.
S&P/Case-Shiller Home Price Indices Year-over-Year Change

Comparing all the home price indices, it needs to be understood each of the indices uses a unique methodology in compiling their index – and no index is perfect.
The way to understand the dynamics of home prices is to watch the direction of the rate of change. Here home price growth generally appears to be stabilize (rate of growth not rising or falling).
There are some differences between the indices on the rate of “recovery” of home prices.


Leave A Comment