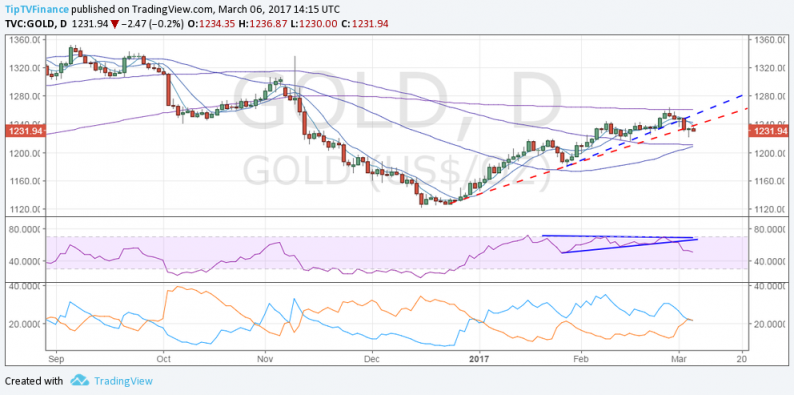
Daily chart

Gold’s failure at 200-DMA hurdle on Feb 27 followed by a breach of the rising trendline, coupled with a bearish break on the RSI suggests the metal has topped out.
Friday’s sharp recovery from the low of $1222.70 appears to be a dead cat bounce, given the prices are failing today to retake the rising trend line hurdle.
The daily chart also shows a bearish 5-DMA and 10-DMA crossover.
Furthermore, a lagging bullish indicator is almost confirmed – bullish crossover between 50-DMA and 100-DMA. This is a lagging indicator, which means confirmation is usually followed by a sell-off/pull back.
The DMI also shows a bearish crossover.
Thus, prices appear on track to test the 50-DMA support seen today around $1208 levels.
On the higher side, only a daily close above $1250 (Friday’s high) would signal bearish invalidation.
EUR/USD outlook: Potential for inverse head and shoulder intact
Daily chart
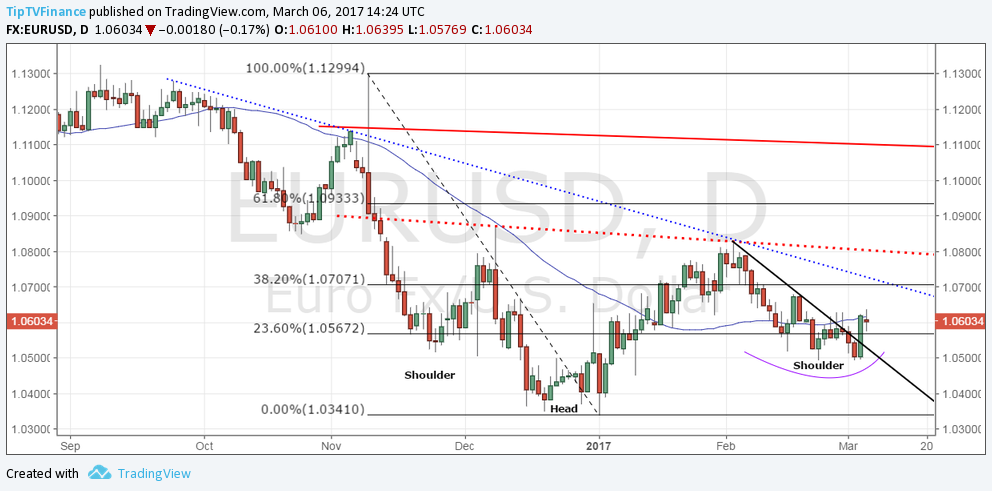
Rebound from 1.05 levels followed by a daily close above 50-DMA on Friday indicates the retreat from the Feb 2 high of 1.0829 has run out of steam.
The 50-DMA has bottomed out as well.
Another day end close above 50-DMA would open doors for the descending trend line hurdle (blue dotted line). A violation there would expose the inverse head and shoulder neckline level seen around 1.08.
The technical picture goes well with the ECB QE taper talk gathering pace.
Only a daily close below 1.05 would revive the bearish view.


Leave A Comment