
According to Blackrock, since the S&P 500 hit its October 2007 peak of 1565, it has produced a total return of approximately 60%. The market gains are three times the increase in the growth of the U.S. economy itself (GDP); they are also three times the increase in the growth of corporate earnings.
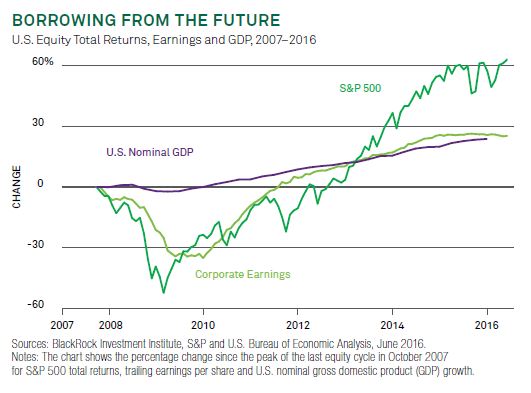
What does it mean to experience market gains that are roughly three times the increases in US nominal GDP and corporate earnings? It implies that we are borrowing stock gains that we would have had in the future and, instead, experiencing tomorrow’s gains today. Stated differently, investors will be paying back present returns with sub-par future results. This is what happens when significant detachment from underlying economic fundamentals and corporate profits occur.
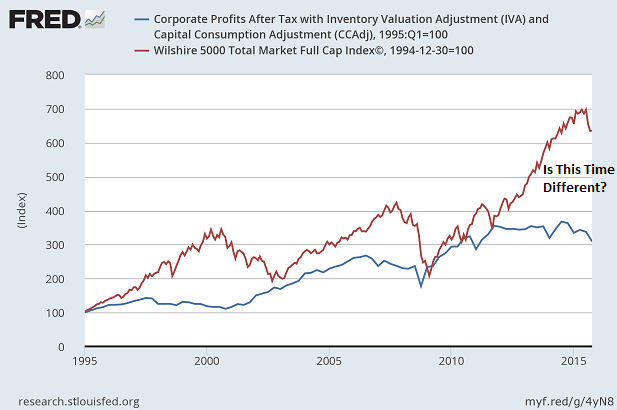
Could this time be different? It could be. The creation of electronic currency credits (e.g., dollars, yen, pounds, euros, etc.) by central banks around the globe has certainly pushed financial matters into uncharted waters.
On the flip side, there is a tendency for stock benchmarks to revert back to a corporate profits trend as well as a price trend. They did so in the 2000-2002 tech wreck; they did so in the 2007-2009 financial collapse.
Consider the regression chart below. On the last two occasions where the S&P 500 reached the two standard deviation level – 142% above the trend (circa 3/2000) and 82% above the trend (near 10/2007) – the index reverted back (i.e., black line.) If the heralded benchmark were to revert back to its trend today, The S&P 500 would trade near 1150. That represents a 46.8% bearish price descent from 2160.
The tendency for prices to revert back to corporate profit trends and/or price trends should encourage investors to be mindful of additional evidence of stock overvaluation. For example, there was a time when Warren Buffett touted market-cap-to-GDP as his premier valuation tool. When the market capitalization of the Wilshire 5000 relative to gross national product (GNP) reached extraordinary heights in both 2000 as well as 2008, the subsequent reversions back to the longer-term average (mean) culminated in 50% price haircuts. What might a reversion to the market-cap-to-GNP ratio mean this time around?


Leave A Comment