
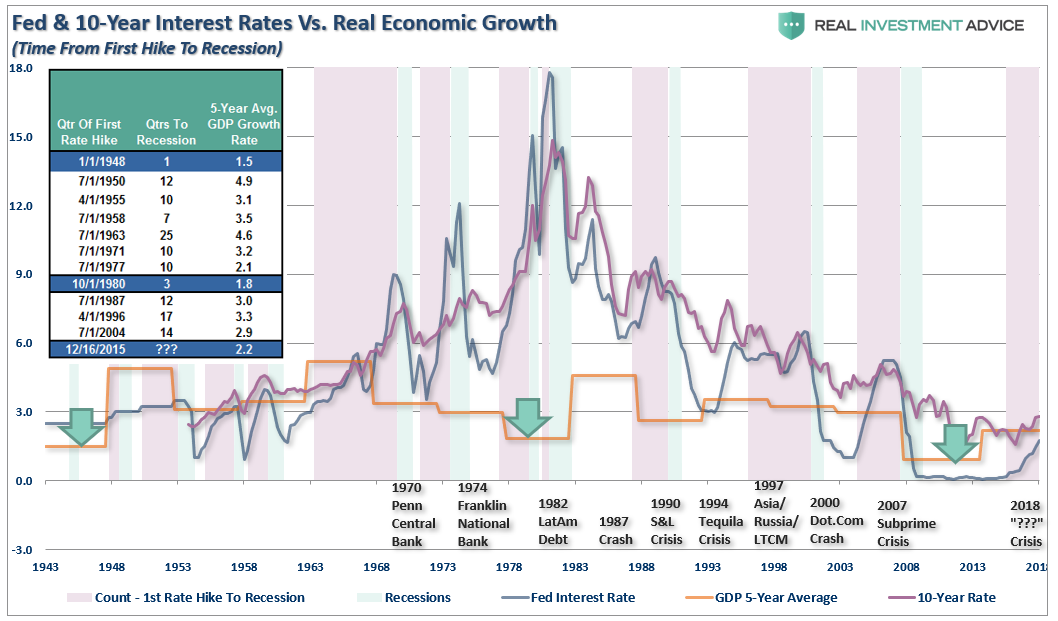
I recently penned an article which discussed the Fed and the risk of a monetary policy error in the future. This isn’t a possibility, it is a probability given that every Fed rate-hiking campaign in the past has led to a financial market-related event, recession, or worse.
Of course, when you publish views on a regular basis it always attracts those“individuals” who want to consistently deride and distract an otherwise informed debate. Normally, I don’t respond to comments because there is nothing to be gained in trying to persuade someone who is already convicted of their beliefs.
As my dad use to tell me growing up: “The only permanent cure of ignorance, is experience.”
I am going to make an exception this week as a recent comment brought to light many of the common media-driven narratives about investing. The comment was long, so I have broken it down to highlight the important points which need addressing.
The Lie Of Percentages
“The average bear market lasts 1.4 years on average and falls 41% on average.-The average bull market (when the market is rising) lasts 9.1 years on average and rises 476% on average. This fact confirms that Bull Markets do rise 10 TIMES LONGER than bear markets. And they last SIX LONGER. Those are facts.”
While the statement is not false, it is a false narrative. (It is important to remember the “buy and hold” revolution was developed by Wall Street firms beginning in the late 1980’s to shift the industry from a “transactional basis” to an “annuitized” income stream. It is great for them, not necessarily for you.)
Using “percentage changes” distorts to the true impact to what happens to investors over time. The chart below shows the PERCENTAGE return of each bull and bear market going back to 1900. (The chart is the S&P 500 Total Return Inflation-Adjusted index.)
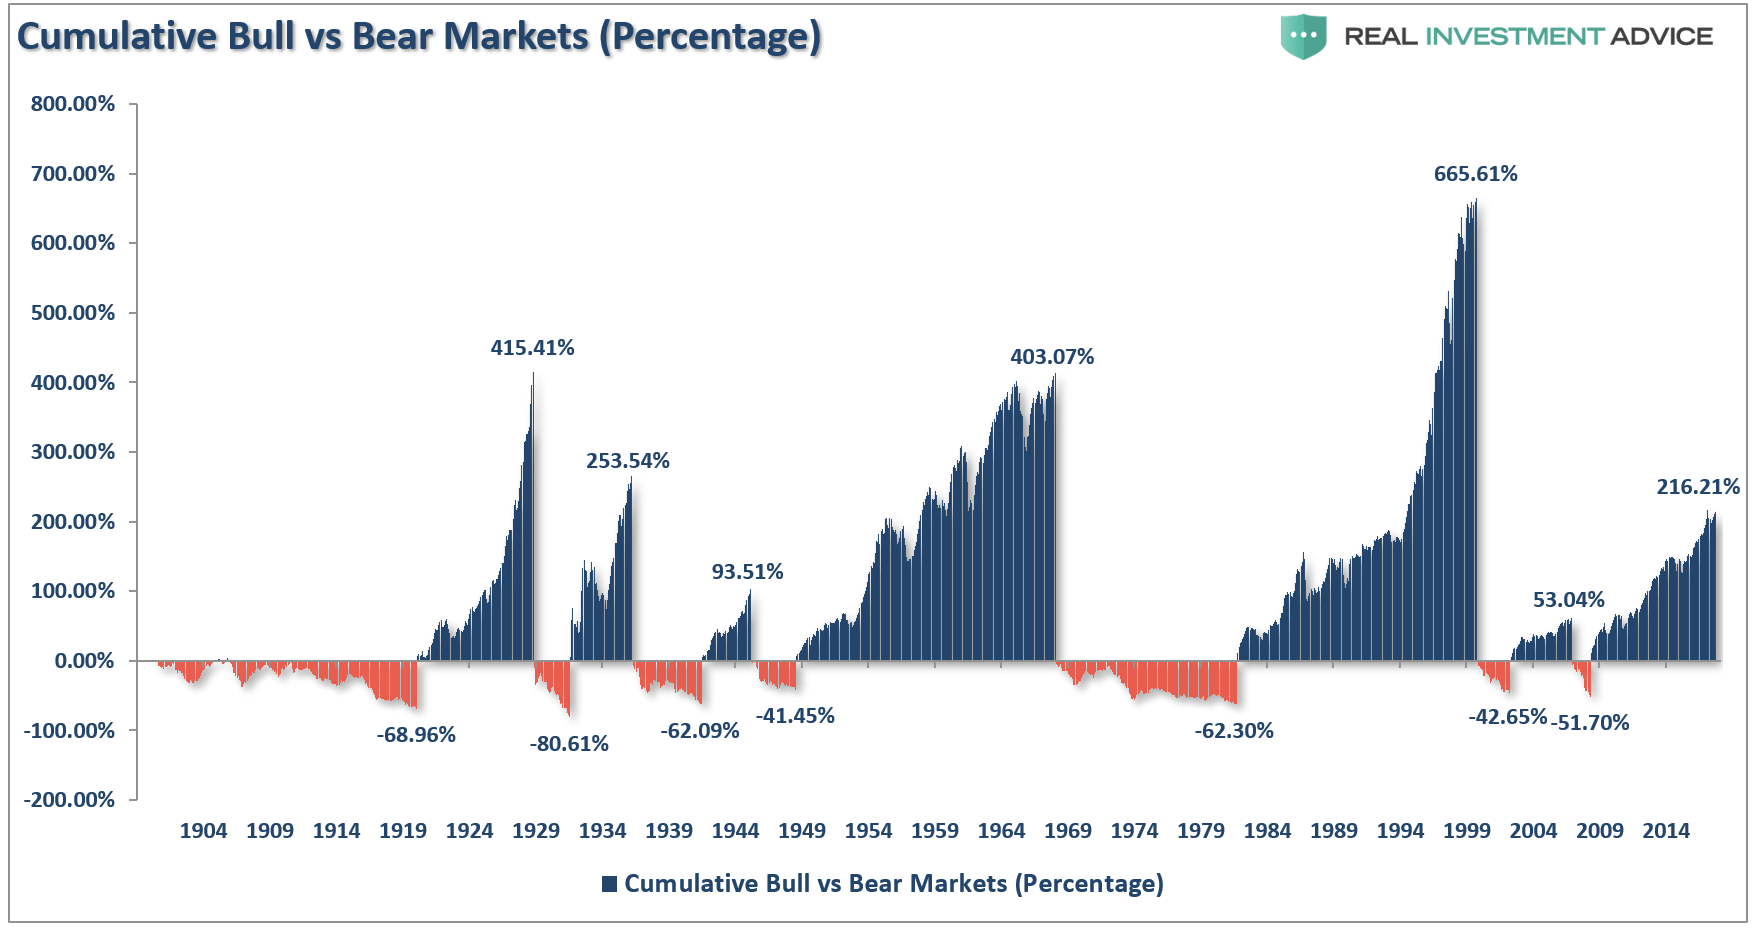
Clearly, the point made is valid that bull markets rise 10x, more and last 6x as long, as bear markets.
“Lies, Damned Lies, and Statistics.” – Mark Twain
Here are the basics of math.
This is the error of measuring returns in terms of percentages. To understand the real impact of bull and bear markets on a portfolio it must be measured in POINTS rather than percentages.
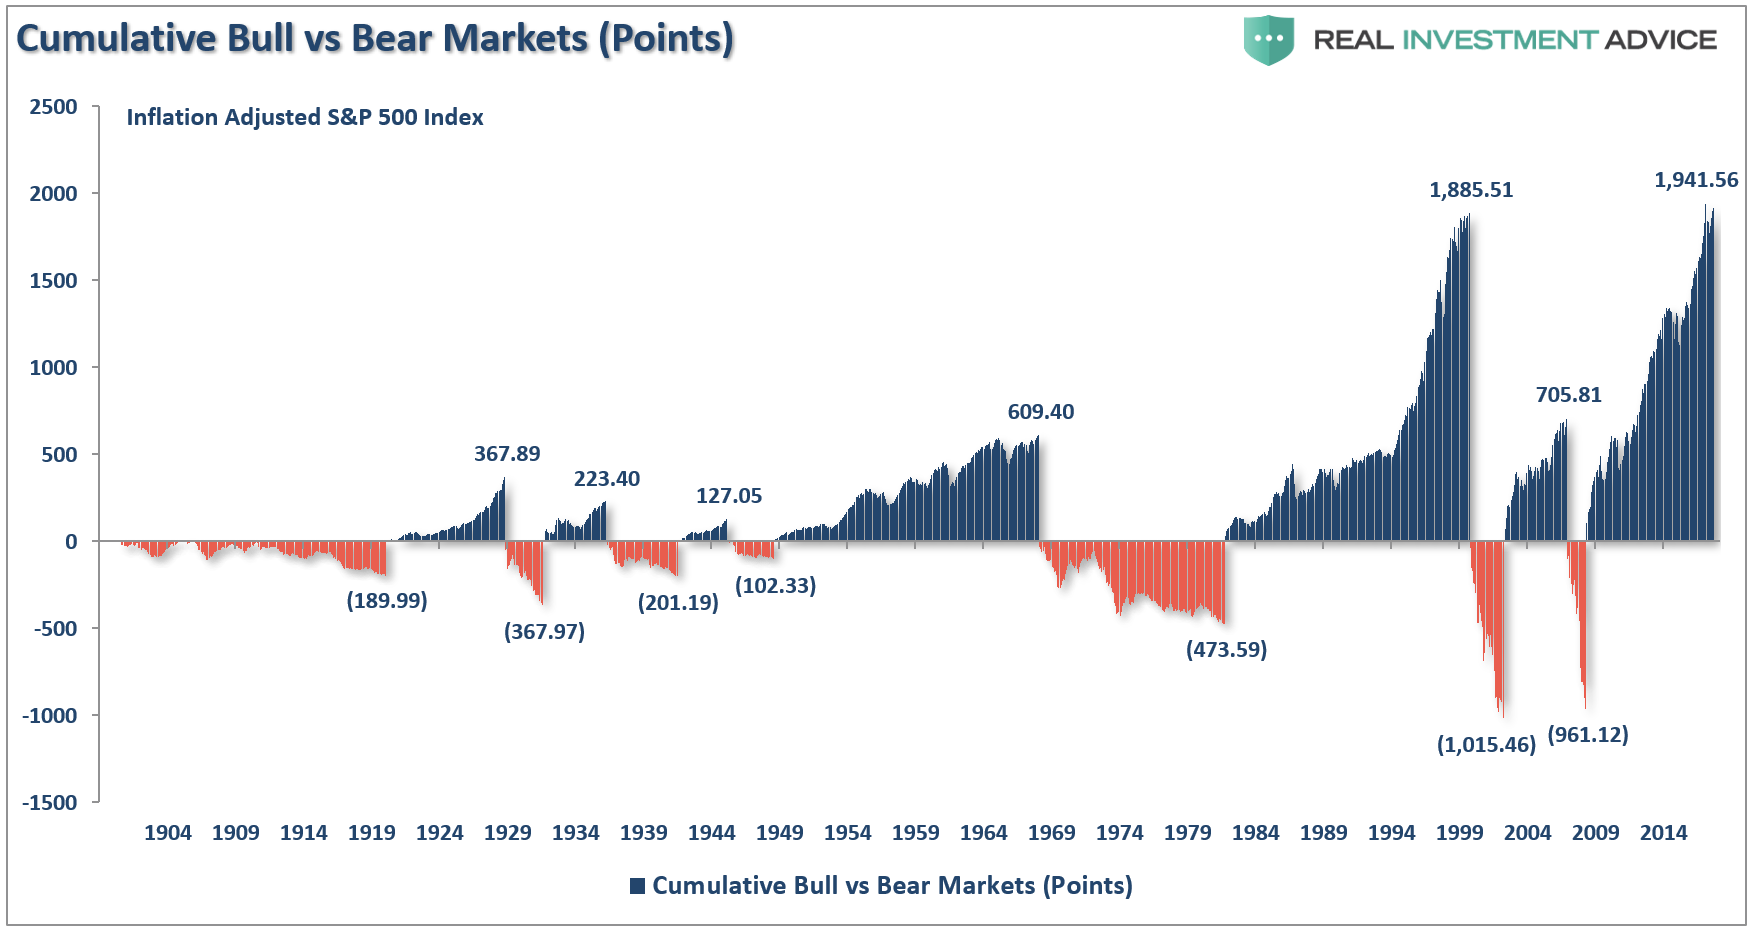
When measured in points, the damage becomes more apparent as bull markets have been almost entirely wiped out by subsequent bear markets.
The other problem, as shown in the chart below, is the lost time required to get back to even following a bear market. During these periods, wealth is not compounded and time required to achieve financial goals is lost.
(It is worth noting the entirety of the markets return over the last 118-years occurred in only 4-periods: 1925-1929, 1959-1968, 1990-2000, and 2016-present)
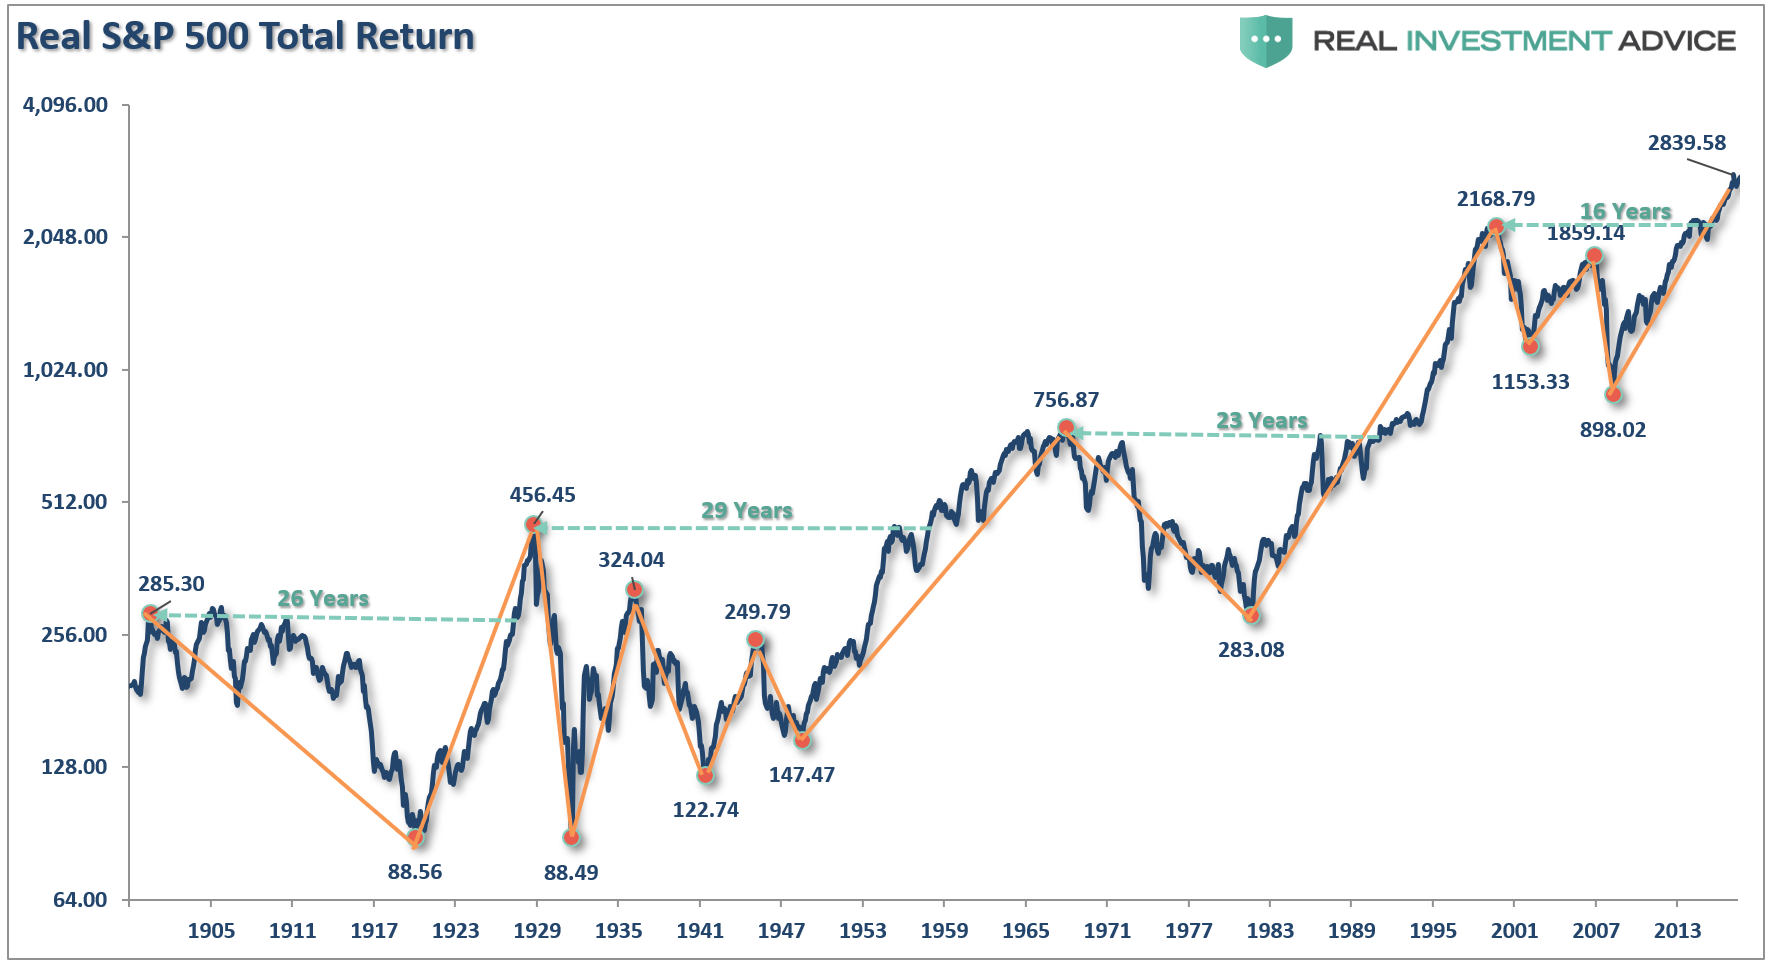
Since most investors only have 20 to 30-years to reach their goals, if that period begins when valuations are elevated, the odds of success falls dramatically.


Leave A Comment