
Last December the Fed began what it thought at the time was a new cycle of tightening. Fed Chair Janet Yellen’s statements last week suggest the Fed still sees this plan as underway. A comparison with historical tightening cycles sheds some light on why so far the Fed hasn’t followed through.
The graph below plots the fed funds rate over the last 30 years and highlights 4 historical tightening episodes in 1988, 1994, 1999, and 2005. The fed funds rate went up by 300 basis points on average in these episodes within the space of one or two years.
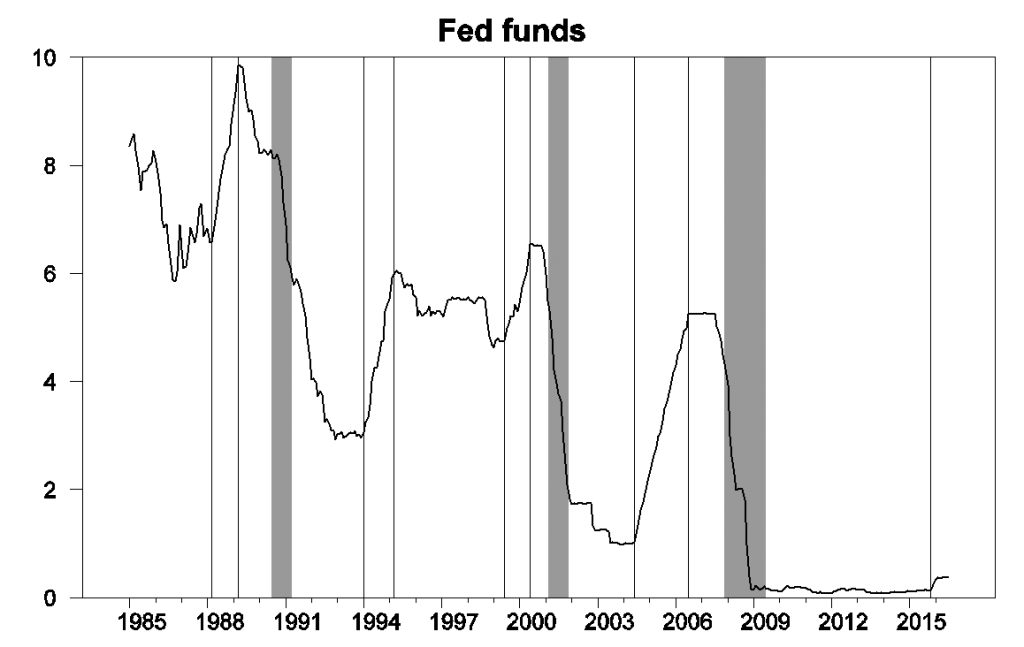
Monthly average of effective fed funds rate, Jan 1985 to July 2016. Shaded regions denote NBER recessions and vertical lines drawn at 1988:3, 1989:3, 1994:1, 1995:3, 1999:6, 2000:6, 2004:6, 2006:7, and 2015:11.
These 4 episodes have several things in common. First the inflation rate rose during each of these episodes and was on average above the Fed’s 2% target, a key reason the Fed moved as it did. Second, the unemployment rate declined during each of these episodes and ended below the Congressional Budget Office estimate of the natural rate of unemployment, again consistent with an economy that was starting to overheat. Third, the nominal interest rate on a 10-year Treasury security rose during each of these episodes, consistent with an expanding economy and rising aggregate demand.
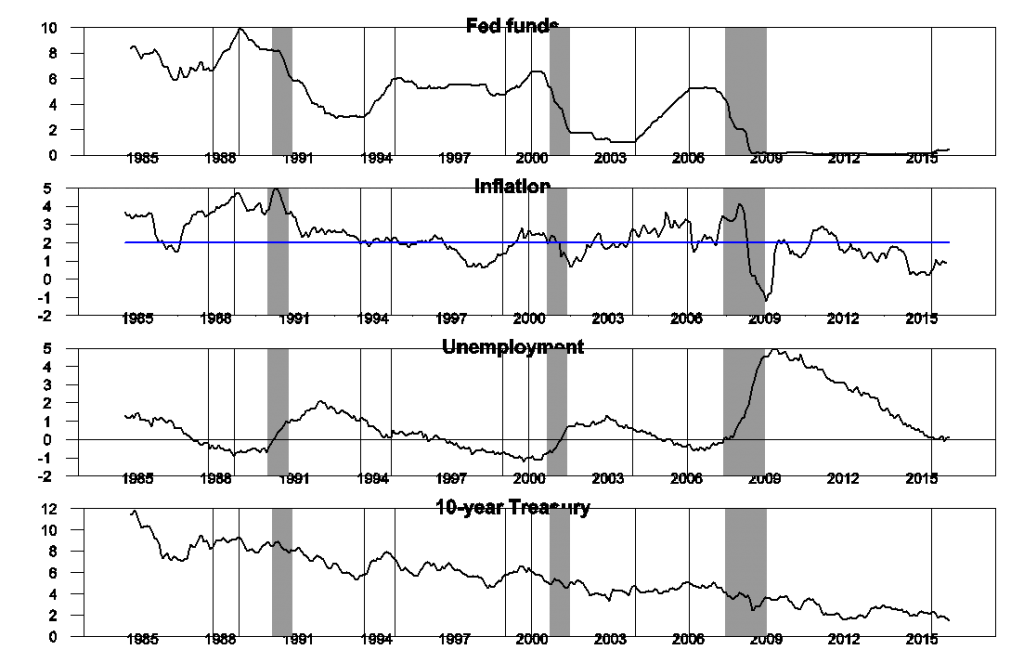
Top panel: effective fed funds rate, Jan 1985 to July 2016. Second panel: Annual inflation rate as measured by the 12-month change in the natural logarithm of the monthly PCE price deflator, with blue line indicating 2%. Third panel: difference between unemployment rate and CBO estimate of natural unemployment rate. Fourth panel: Interest rate on 10-year Treasury bond.
The FOMC anticipated in December that it would implement 4 more rate hikes in 2016 and another 4 in 2017, a bit slower than the typical tightening cycle highlighted above, but a clear tightening cycle nonetheless. So far they have implemented zero increases beyond the first modest move in December.


Leave A Comment