Although GBP/USD increased a bit recently, the resistance area created by the mid-October highs continues to keep gains in check. What’s next for the exchange rate?
EUR/USD
In our Forex Trading Alert posted on September 25, we wrote the following:
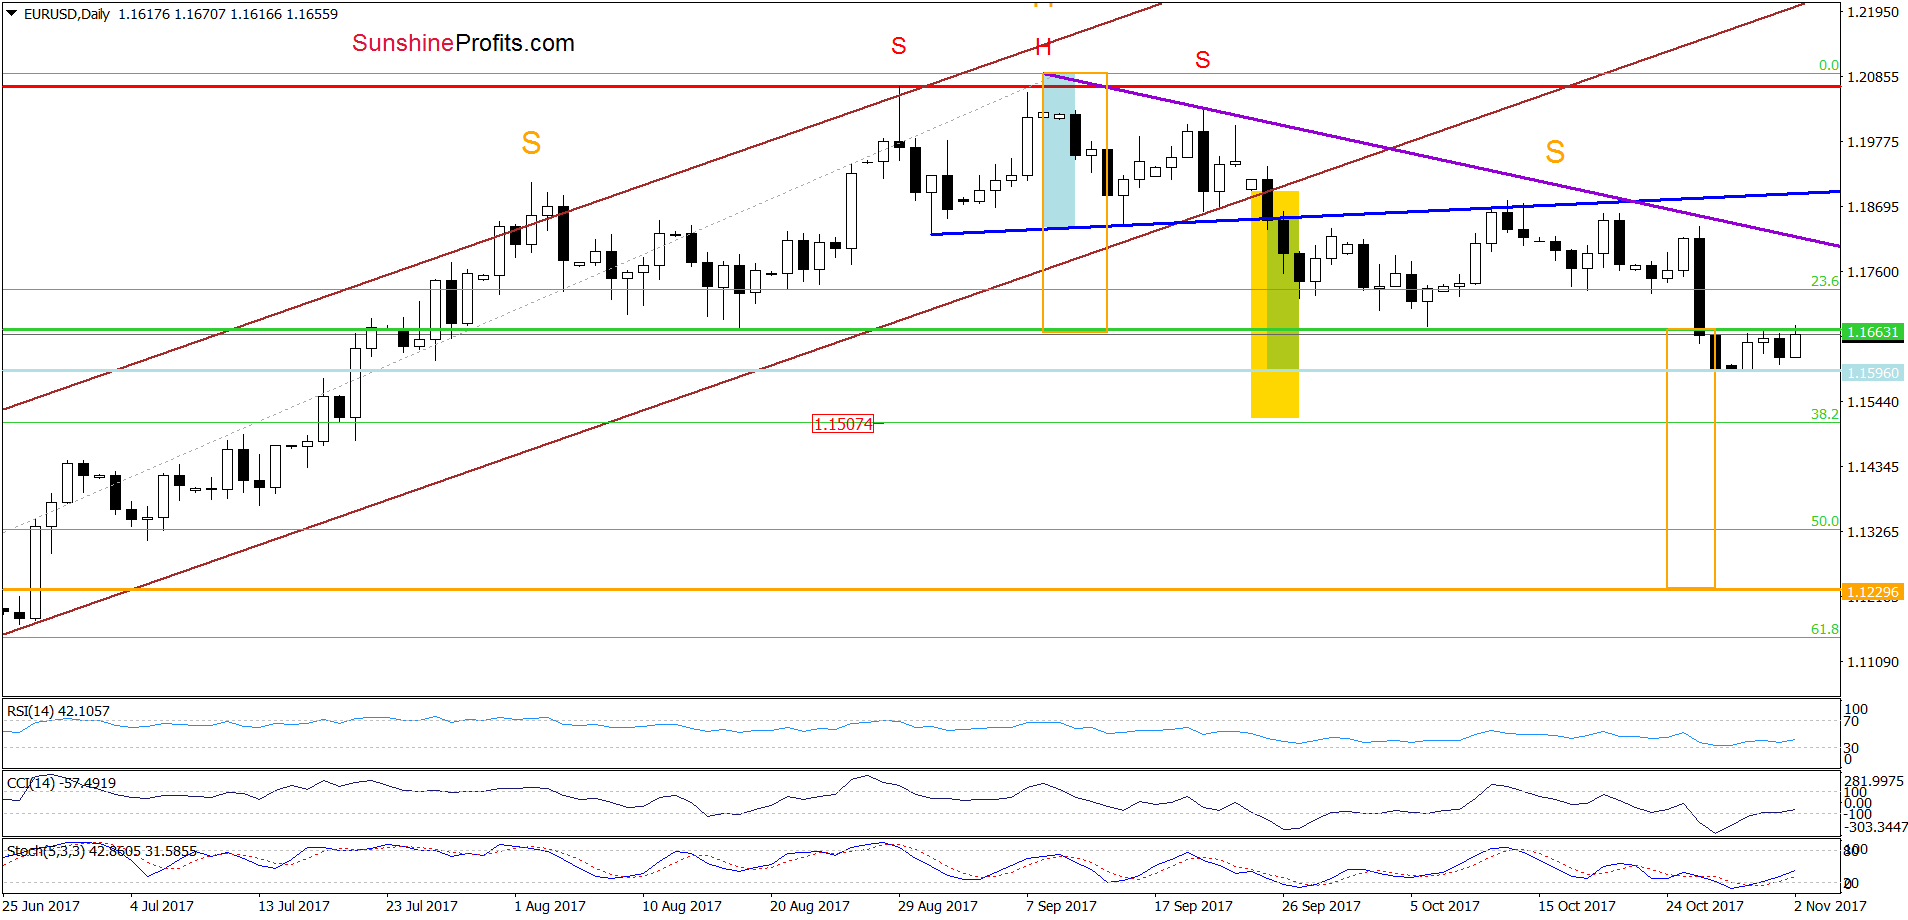
(…) we clearly see a potential head and shoulders formation. Therefore, if EUR/USD declines under the neck line of the pattern (the blue support line based on the previous lows), we’ll see a downward move to around 1.1596, where the size of the move will correspond to the height of the formation.
From today’s point of view, we see that currency bears realized the above-mentioned scenario on Friday, which somewhat reduced the selling pressure and resulted in a rebound in the following days.
Despite the recent increase, the green horizontal line based on the mid-August and early October lows continues to keep gains in check. This suggests that as long as there is no daily closure above this resistance all upswings could be nothing more than verifications of the earlier breakdown below this line.
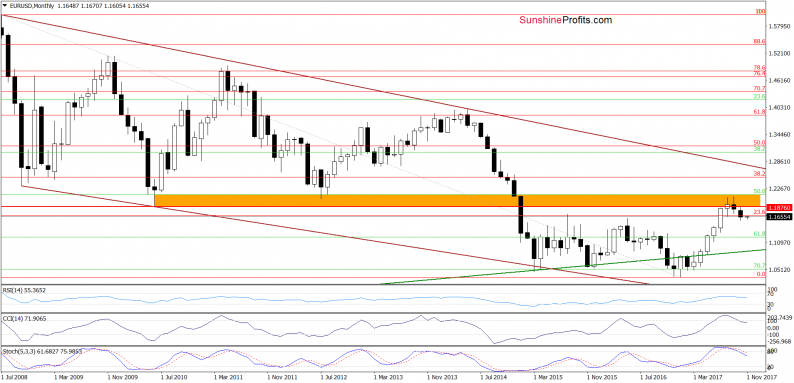
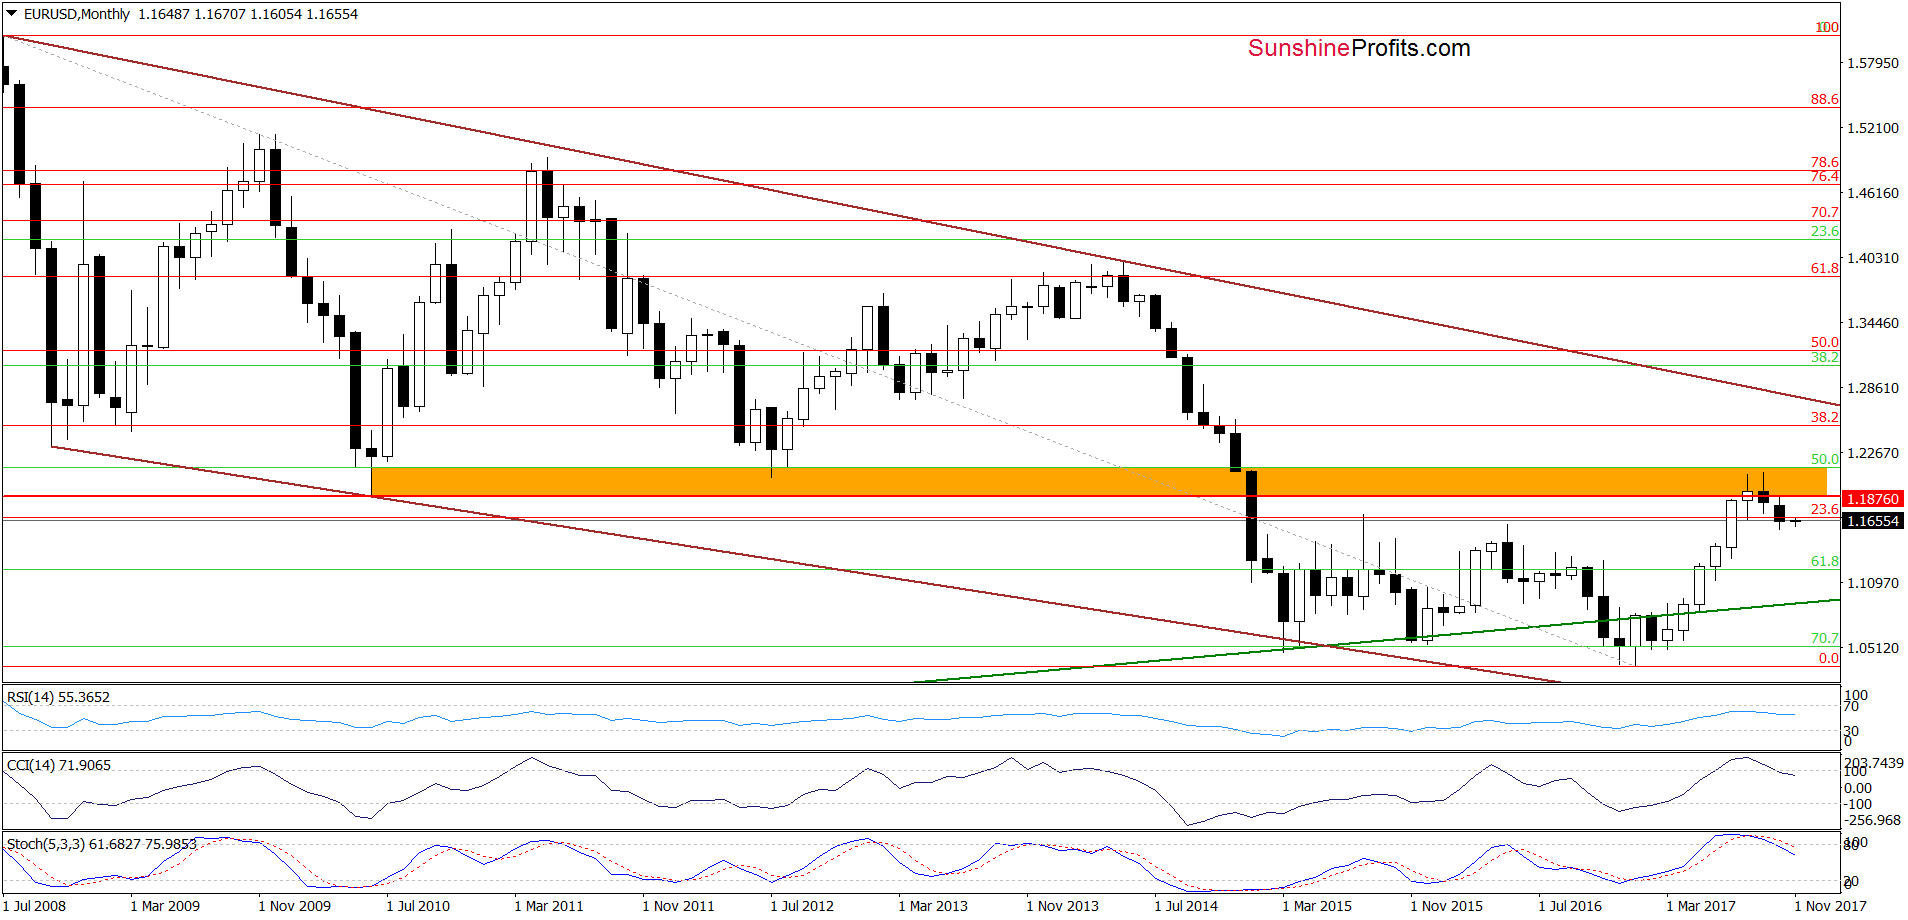
What does it mean for the exchange rate? In our opinion, if this is the case and EUR/USD reverses from current levels in the near future, currency bears will likely not only test the recent lows, but also push the exchange rate to around 1.1508, where the size of declines will be equal to the height of the brown rising trend channel. Additionally, slightly below this level is also the 38.2% Fibonacci retracement, which increases the probability of reversal.
Very short-term outlook: mixed with bearish bias
Short-term outlook: bearish
MT outlook: mixed
LT outlook: mixed
GBP/USD
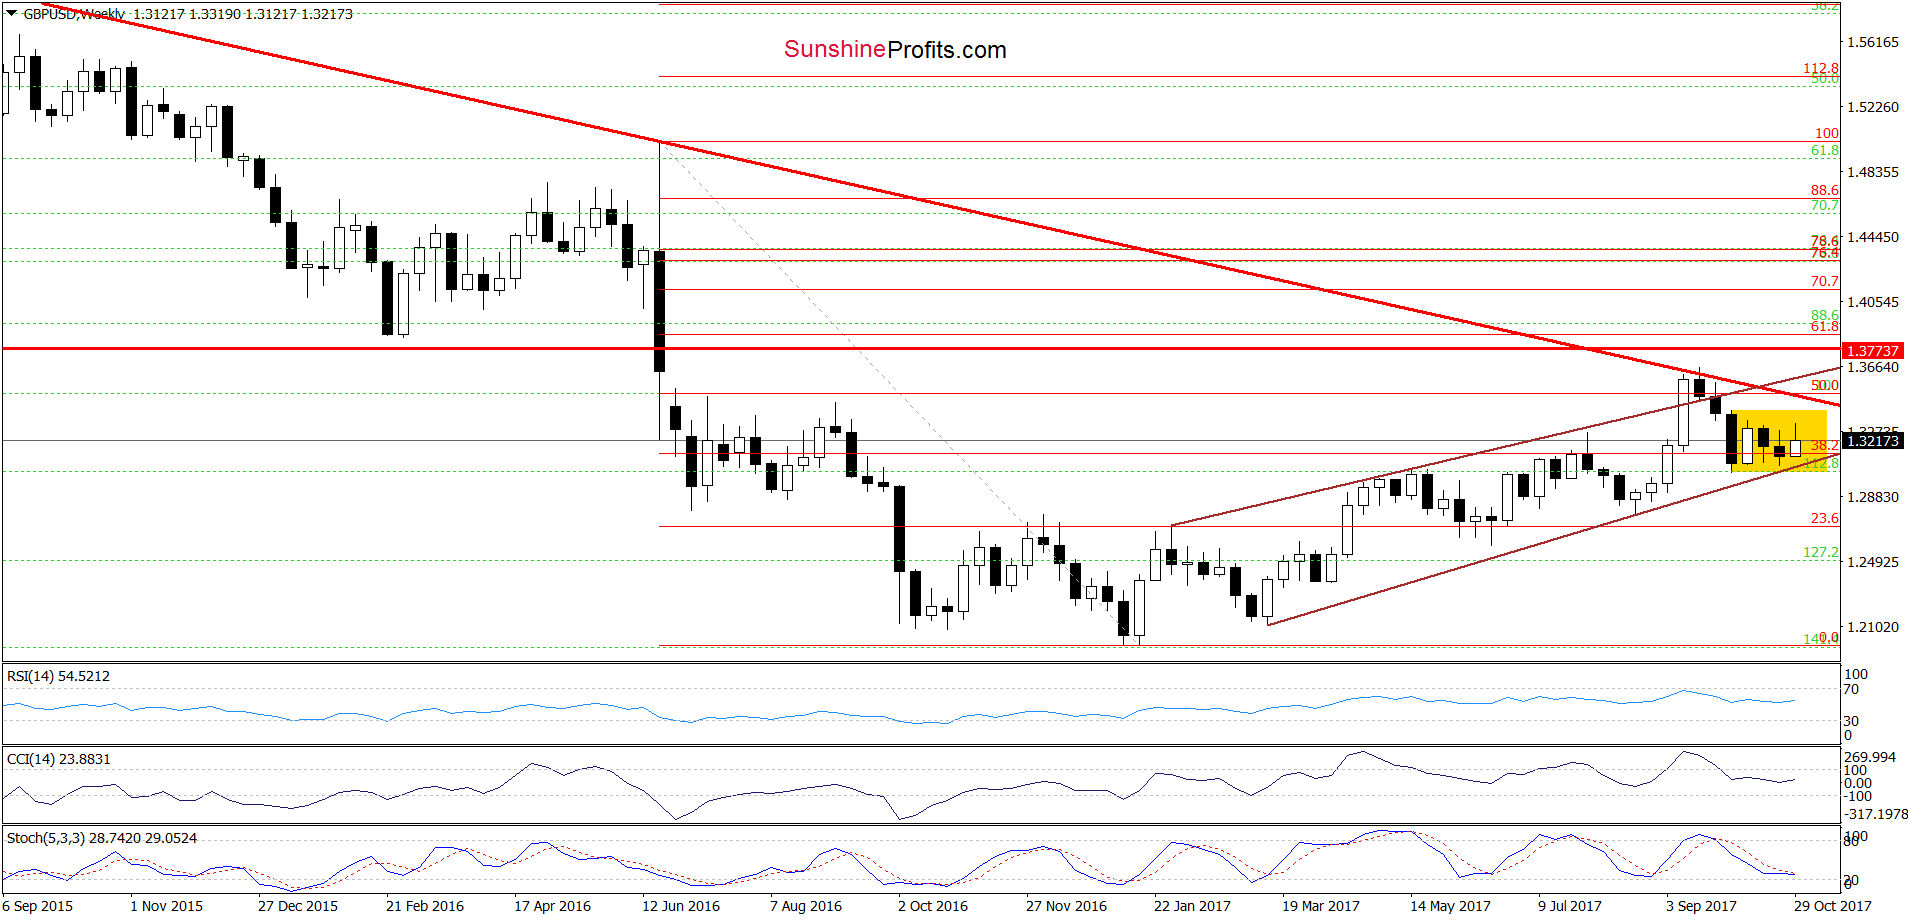
Looking at the weekly chart, we see that the overall situation in the medium term hasn’t changed much as GBP/USD is trading in the yellow consolidation inside the brown rising trend channel, which makes the broader perspective a bit unclear.


Leave A Comment