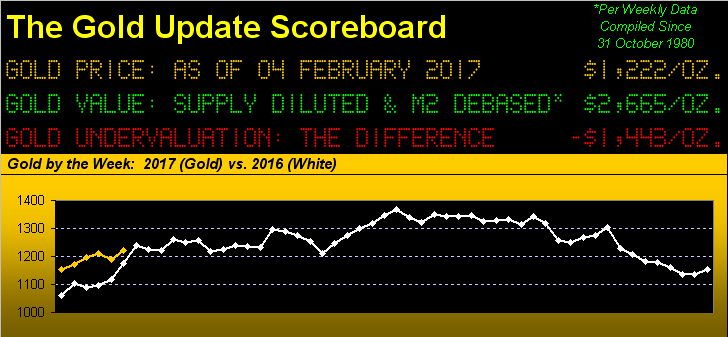
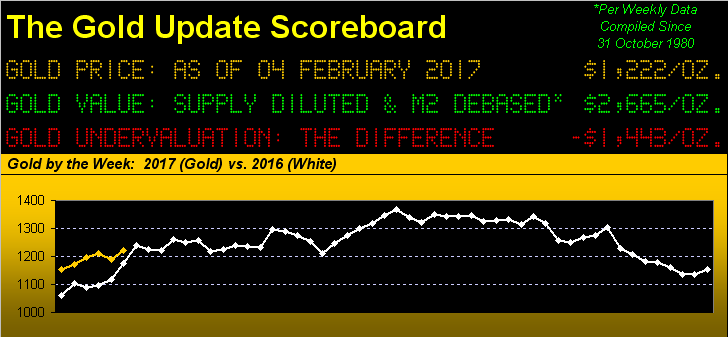
Six weeks into 2017, the above panel shows us Gold’s being ahead of where ’twas over the same time frame in 2016, although the challenge of so staying appears dead ahead.
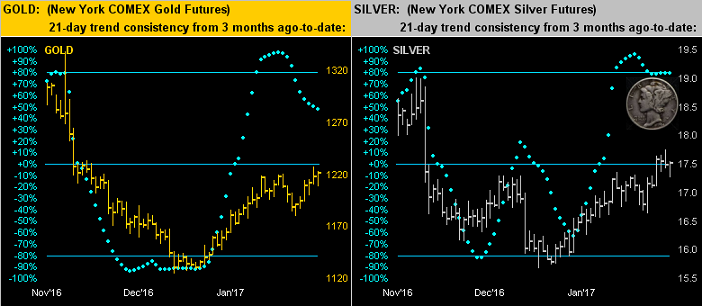
Still, you know you’re sensing a serious commitment to the Gold market upon seeing it stay firm despite the dropping off of late by its “Baby Blues”. For as shown below left across Gold’s daily bars over the last three months, even with the falling blue dots being representative of the 21-day linear regression trend losing its upside consistency, price nonetheless is braving the blues by rising against their descending grain. And as for racy Sister Silver below right, the picture is similar, albeit her blues clearly must be equipped with Formula One-type carbon-fibre disc brakes, the falling dots there having stopped on a dime:
Better still, the ongoing swing back into Gold is keeping price on our anticipated track toward attacking at least the underside of the 1240-1280 resistance zone (the purple lines as next shown), the parabolic Long trend of the weekly bars continuing to unfold:

But as is their wont, our FinMedia friends are instead all again a-gaga as “The Dow” regains its five-digit milestone which begins with “2”, the index itself +1.6% year-to-date. Nary a word ’bout the real leaders, (aka “The Precious Metals”), which one month plus three trading days into 2017 are leading the BEGOS Market Standings as we see here:
‘Course our crony miner colleagues continue to crow over the leverage afforded them by their engaging in the metals equities, made evident by our year-over-year percentage track of comparably “sleepy old Gold” +6% versus those for GG (Goldcorp) +25%, FNV (Franco-Nevada) +37%, GDX (the prominent exchange-traded fund of the Gold miners) +52%, NEM (Newmont Mining) +57%, and SIL (the popular exchange-traded fund of the Silver miners) +98%! “Y’all here at the Circle K take stock certificates?”


Leave A Comment