
In our regular gold trading alerts, we focus on the short- and medium-term outlook and we rarely discuss the very long-term issues or price targets. The reason is simple – the long-term issues and price targets don’t change often, so usually there’s little new to say about them. Consequently, it’s been a long time since we last discussed our view on gold’s explosive upside potential. In fact, it’s been so long that those who do not take the time to read our analyses thoroughly and those who have been reading them for only a short while may think that we are bearish on gold in the long run. Or that we’re perma-bears. Naturally, it’s nonsense and those who have been diligently following our articles know it. What we’re aiming for is to help investors position themselves to make the most of the upcoming rally in the precious metals market and one of the best ways to do it is to help people prepare for the final bottom in gold.
Of course, buying close to the bottom is pointless unless a big rally is going to follow. In today’s analysis we want to tell you how big this rally is likely to be. Well, you have already read it in the title of this article, but the key question is if the above is just a simple round number that we “wish” gold to reach, or if it is based on reasonable arguments. We don’t want you to take our word for it – we’ll show you how we arrived at $6,000 as the minimum target for gold.
But first, we would like to discuss a few reasons that could help to push gold well above the previous highs.
Dollargeddon
The medium-term outlook for gold is very bearish based on multiple technical developments. Even based on some of the fundamental factors, one can expect a decline or a continuation in the sideways trend. Why? Well, there is acceleration in global economic growth combined with still subdued inflation. Hence, U.S. real interest rates (especially short yields) should rise. Another reason is that the U.S. economy (and the overall economy) is less fragile than the euro area, so there are more downside risks related to the euro than to the greenback.
However, gold prices are likely to go up in the coming years, as there are many potential triggers which are likely to support the yellow metal’s performance in the long run. We’ll briefly discuss the most important factors below:
Having discussed why gold is likely to move much higher in the coming years, let’s check how high it might actually go. Naturally, it’s impossible to make a detailed prediction based on the fundamental trends alone, so in order to do it, we’ll apply other techniques that are based on the analogies to what already happened in the past. After all, history tends to repeat itself to a considerable degree as the driving forces (fear and greed) behind price moves don’t change.
Few Words on Methodology
We’re going to show you two ways of obtaining the long-term target for gold and they will have one thing in common – we won’t rely on classic fundamental measures such as supply and demand. We don’t want to get into the details here, but to make a long story short, gold behaves more like a currency than a commodity and its flows are more important for the price than yearly supply and demand figures. Moreover, classic fundamental analysis can only tell you what the true value of a given asset (here: gold) should be, but that’s not really what we’re interested in. Markets tend to become very overbought at the tops, so the above estimation would likely significantly understate the real target for gold’s long-term top.
Consequently, instead of applying the classic, yet most likely imprecise techniques, we’ll use those that are likely to provide more reliable targets, even if they might seem controversial.
Gold’s Analogy to the Previous Bull Market
The first method is to check how the current rally compares to the one seen three decades ago. After all, long-term bull markets go from undervalued to overvalued and since history tends to repeat itself, then a look at the previous bull market should tell us how high gold should move this time as well. Gold has been traded globally during both bull markets and since human psychology doesn’t change much (investors are as greedy and as fearful as they were decades ago), we can expect the entire size of the bull market to be repeated.
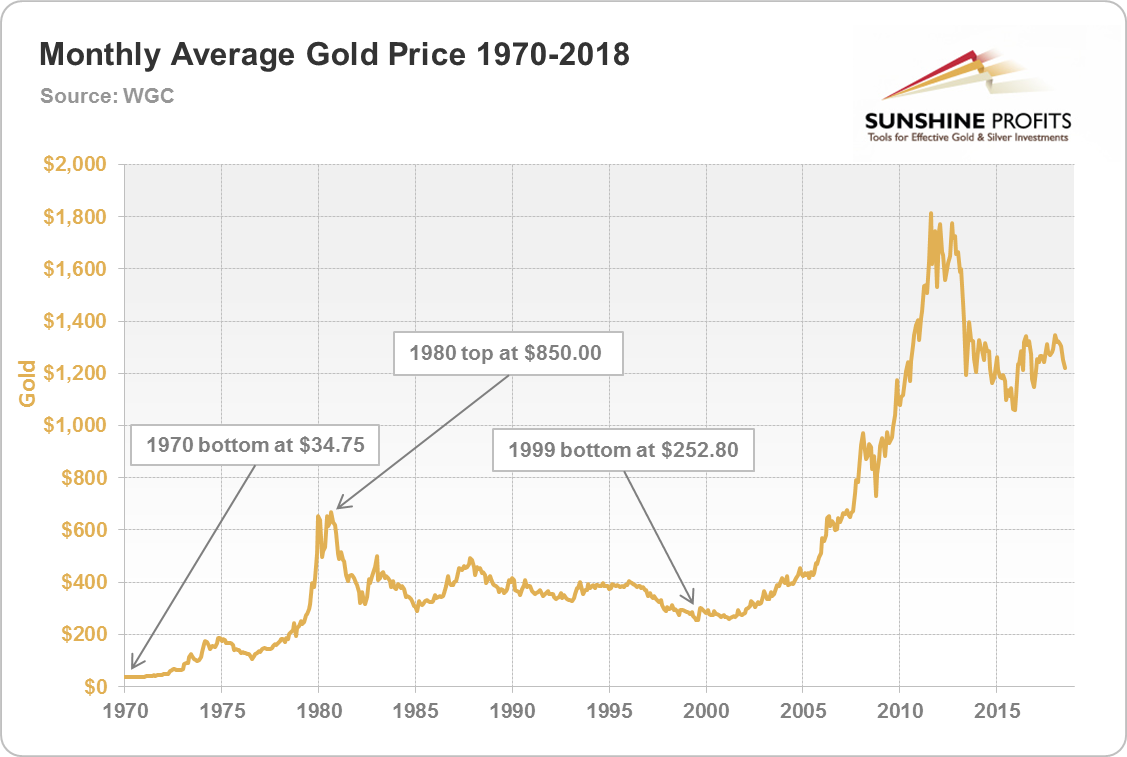
The question is – in what terms. Definitely not in nominal terms because both bull markets started from different price levels ($34.75 vs. $252.80) and thus a similar price move allows for much greater appreciation of capital as the entry price would have been several times lower. Moreover, the value of the dollar is a big issue when comparing prices from different decades. To make it more difficult, we can’t simply adjust the prices for inflation, because the way inflation is measured has not been consistent over time. One way to avoid the above problem is to use alternative inflation data, but we’ll do something more straightforward.
We’ll use relative valuations. How many times did gold multiply its price during the previous bull market? That’s the exact question that defines how much money was to be made in dollar terms. Inflation was soaring, but something similar could be the case in the final months of the current gold bull market as well. Consequently, not only is that not a problem – relative valuation accounts for this specific aspect.
So, how many times did the price of gold increase during the previous bull market? Gold rallied from $34.75 to about $850, which means that its price increased 24.46 times. Gold’s bottom in the case of the current bull market was $252.80. Multiplying the latter by the former gives us $6,184 as the future price prediction for gold. This may seem too simple, but it really does take quite a few things into account.
Some may say that the above analogy is incorrect, because under the gold standard gold’s price was kept artificially low and thus the comparison to the initial price will give us a rally that’s too big. In other words, the assumption here would be that if gold’s price hadn’t been fixed, it would not have got as low as it did and thus, gold wouldn’t have multiplied as many times.
Certainly, this could have been the case, but… There’s one small detail that confirms that we can indeed use the mentioned technique. The detail is that once gold’s price was allowed to float it didn’t soar immediately. Conversely, the move higher was rather normal, just like prices of undervalued assets increase in value during regular bull markets.
If gold had soared from $35 to $100 or so overnight, then we could view $100 as the first real price of gold and start the analogy from that price. But, nothing like that happened. There was a gradual price increase during which gold also corrected and declined. Yes, the fact that gold wasn’t allowed to trade freely under the gold standard was a significant bullish factor for the entire 70s bull market, but other bull markets have other underlying fundamentals that can be just as bullish. Just because the gold standard ended only once doesn’t mean that the 70s bull market was very different from the other ones. We’ll comment on that in greater detail in the following part of this essay.
Gold Compared to the General Stock Market
Comparing gold to the general stock market is very useful as both asset classes are often viewed as alternatives. Both are impacted by inflation, so their ratio should not be affected by the latter. Moreover, the ratio already proved to be useful on an approximate basis – the last major top and major bottom were somewhat in tune with the previous extremes. Consequently, this tool should be very useful in estimating how high gold can rally before THE top is in.


Leave A Comment