
Week 42 of 2018 shows same week total rail traffic (from same week one year ago) improved according to the Association of American Railroads (AAR) traffic data. Unfortunately, rail is approaching no growth.

Analyst Opinion of the Rail Data
Rail’s good growth seems to be running out – and the overall rate of growth in 2018 has slowly decelerating – and this week there is little growth.
We review this data set to understand the economy. If coal and grain are removed from the analysis for carloads, this week it contracted 0.02 %. We primarily use rolling averages the analyze the data due to weekly volatility – and the 4 week rolling average for the intuitive sectors declined from 1.3 % to 0.8 %.
Intermodal transport (containers or trailers on rail cars) growth is also slowing year-over-year – and is only up 1.6 % YoY.
The following graph compares the four-week moving averages for carload economically intuitive sectors (red line) vs. total movements (blue line):
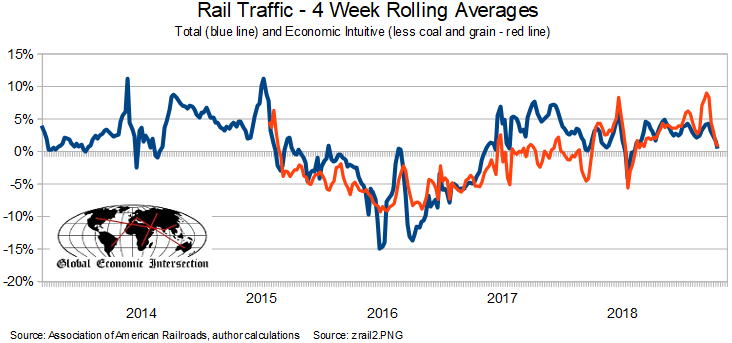
.This analysis is looking for clues in the rail data to show the direction of economic activity – and is not necessarily looking for clues of profitability of the railroads. The weekly data is fairly noisy, and the best way to view it is to look at the rolling averages (carloads [including coal and grain] and intermodal combined).
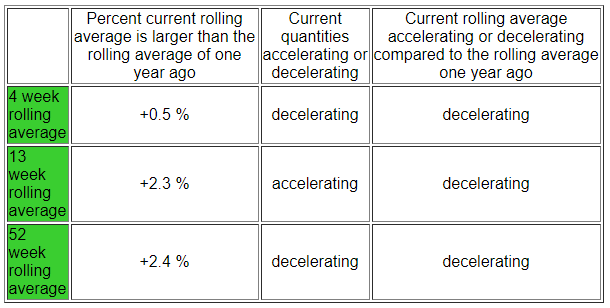
A summary of the data from the AAR:
For this week, total U.S. weekly rail traffic was 555,106 carloads and intermodal units, up 0.5 percent compared with the same week last year.
Total carloads for the week ending October 20 were 265,776 carloads, down 0.7 percent compared with the same week in 2017, while U.S. weekly intermodal volume was 289,330 containers and trailers, up 1.6 percent compared to 2017.
Five of the 10 carload commodity groups posted an increase compared with the same week in 2017. They included petroleum and petroleum products, up 1,790 carloads, to 11,955; miscellaneous carloads, up 1,267 carloads, to 11,370; and metallic ores and metals, up 1,056 carloads, to 23,369. Commodity groups that posted decreases compared with the same week in 2017 included nonmetallic minerals, down 3,788 carloads, to 36,102; grain, down 1,594 carloads, to 22,431; and farm products excl. grain, and food, down 722 carloads, to 16,808.
For the first 42 weeks of 2018, U.S. railroads reported cumulative volume of 11,047,756 carloads, up 1.8 percent from the same point last year; and 11,691,908 intermodal units, up 5.7 percent from last year. Total combined U.S. traffic for the first 42 weeks of 2018 was 22,739,664 carloads and intermodal units, an increase of 3.8 percent compared to last year.


Leave A Comment