
The S&P 500 index is arguably the most well-known worldwide. It is based on the market cap of the 500 largest companies in the U.S. The first-ever ETF, introduced in 1989, hoped to mimic the index, but was short-lived due to a lawsuit. Several S&P 500 ETFs have been brought to market since, and we show their performance, as well as the tracking error relative to the S&P 500 Total Return Index (which assumes reinvestment of dividends).
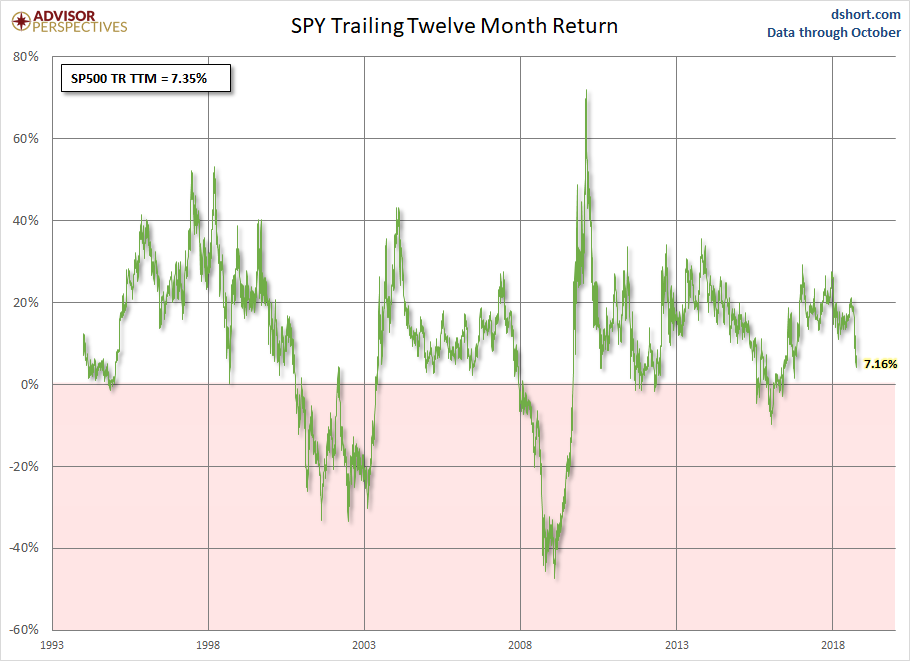
The S&P 500 ETFs tracked here include State Street Global Advisors’ SPDR (SPY), iShares Core S&P 500 ETF (IVV), and Vanguard’s S&P 500 ETF (VOO). The first chart presents the trailing twelve-month price return for SPY (IVV and VOO are almost identical). Figures are through September month-end.
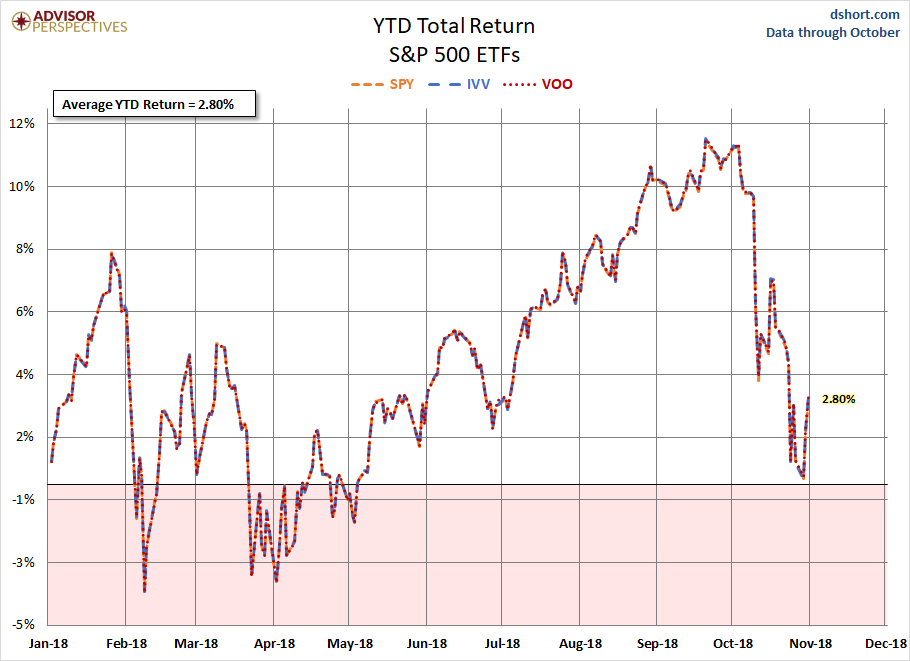
Here is the YTD return for all three including their average, now at 2.80% – note the close tracking, as expected.
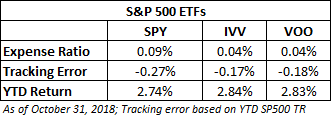
Finally, here is a table listing each ETF’s tracking error, expense ratio, and YTD return.
Check back in early December for the next update.


Leave A Comment