
The complacency going into this earnings season came to a definitive end this past week. The divergences exposing the stock market’s underlying weakness further expanded and are even more striking. The pressures have pushed T2108, the percentage of stocks trading above their respective 40-day moving averages (DMAs), ever closer to oversold territory (below 20%). T2107, the percentage of stocks trading above their respective 200DMAs, looks like it topped out.
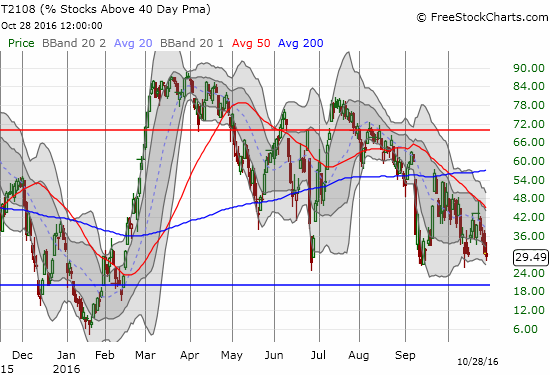
T2108 has firmly returned to the post-Brexit lows and sits within striking distance of oversold levels. Can my favorite technical indicator bounce from this support one more time?
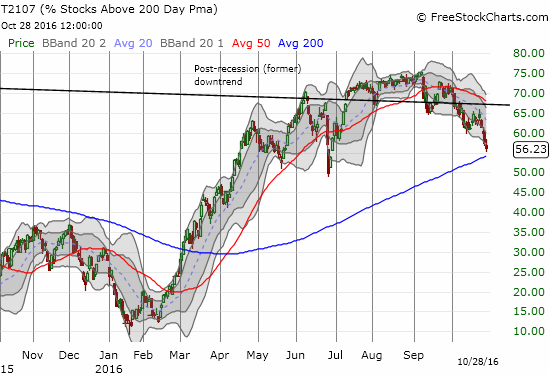
T2107 is ominously topping out as the post-recession downtrend reasserts itself.
The S&P 500 (SPY) is performing valiantly given it has failed to break free from 50DMA resistance since Fedspeak helped knock it down in early September. I am still assuming that a trading range is in effect until the U.S. Presidential election, but that assumption looks ever more tenuous.
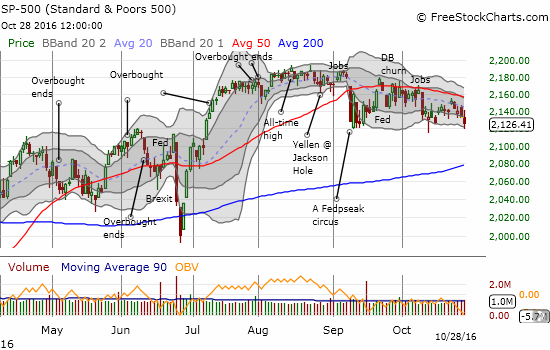
The 50DMA once again capped the S&P 500 (SPY). It closed the week drooping toward the bottom of the recent range.
Suddenly the NASDAQ (QQQ) is also struggling with its 50DMA. Just a month ago, the NASDAQ’s out-performance shone as a market beacon. On Monday, the tech-laden index gapped up convincingly toward its all-time high. The index sold off for four straight days and ended the week with a 50DMA breakdown. The chart below suggests that the NASDAQ is working on a double top. A breach of September’s low would confirm the double top. Bears should duly note how the sharp and intense selling following Brexit set the stage for invalidating the last double top that formed with the April and June highs.
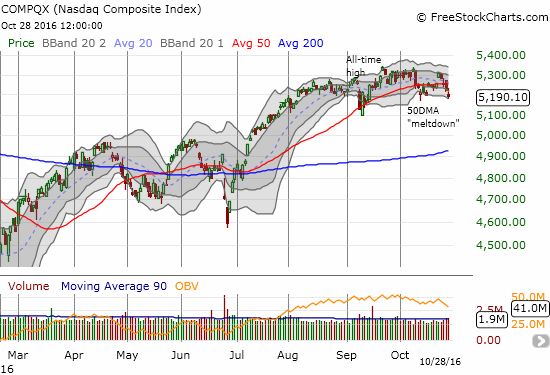
The NASDAQ gapped up to start the week and then proceeded to sell-off the rest of the week to a new closing low for October. The tech-laden index is finally looking toppy.
Interestingly, election-related news likely drove the market’s latest bout of weakness. The S&P 500 was working on drifting into the close with a small gain when news broke about FBI Director James Comey sending a letter to Congress about new Hillary Clinton emails. Rumors, commentary, and counter-commentary swirled, but the stock market never managed to stage a complete comeback. The 5-minute chart below shows the knockdown and subsequent volatility.
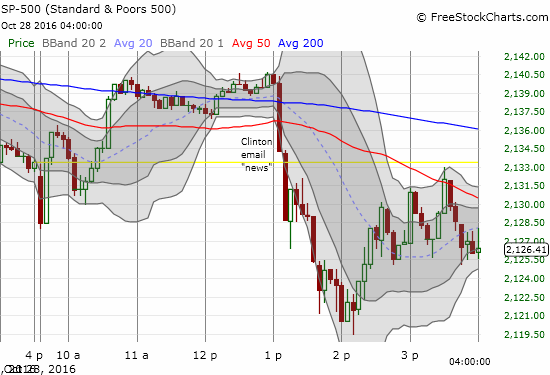
This 5-minute chart shows how quickly the S&P 500 (SPY) sold off on the latest news of Clinton emails. The market never fully recovered as clarifications rolled on throughout the day.
Given T2108 was around 30% and seeing how fast the market reacted to a developing story, I decided to jump on SPY call options. When the market first bounced, I was astounded to see the call options gain over 30%. I quickly took profits and set a limit order to buy again at my original price. Sure enough, the market obliged. I then decided to double down with put options on ProShares Ultra VIX Short-Term Futures (UVXY). The volatility index, the VIX, soared on the day but faded hard from its intraday high. I strongly suspect that the VIX will cool down on Monday. This assumption is risky since the VIX closed above the 15.35 pivot. Note the series of lower highs and higher lows forming a subtle wedge pattern on the VIX. I am basically betting that volatility will quickly calm back down as it has done with recent spikes.


Leave A Comment