

I haven’t written about it much lately, as over the past few months the trade has been quite a dud, but I still love owning US notes versus short German bunds.
Going into the end of 2016, there was tons of press as the German bund / US T-note 10-year spread hit the “obscene” level of 235 basis points.
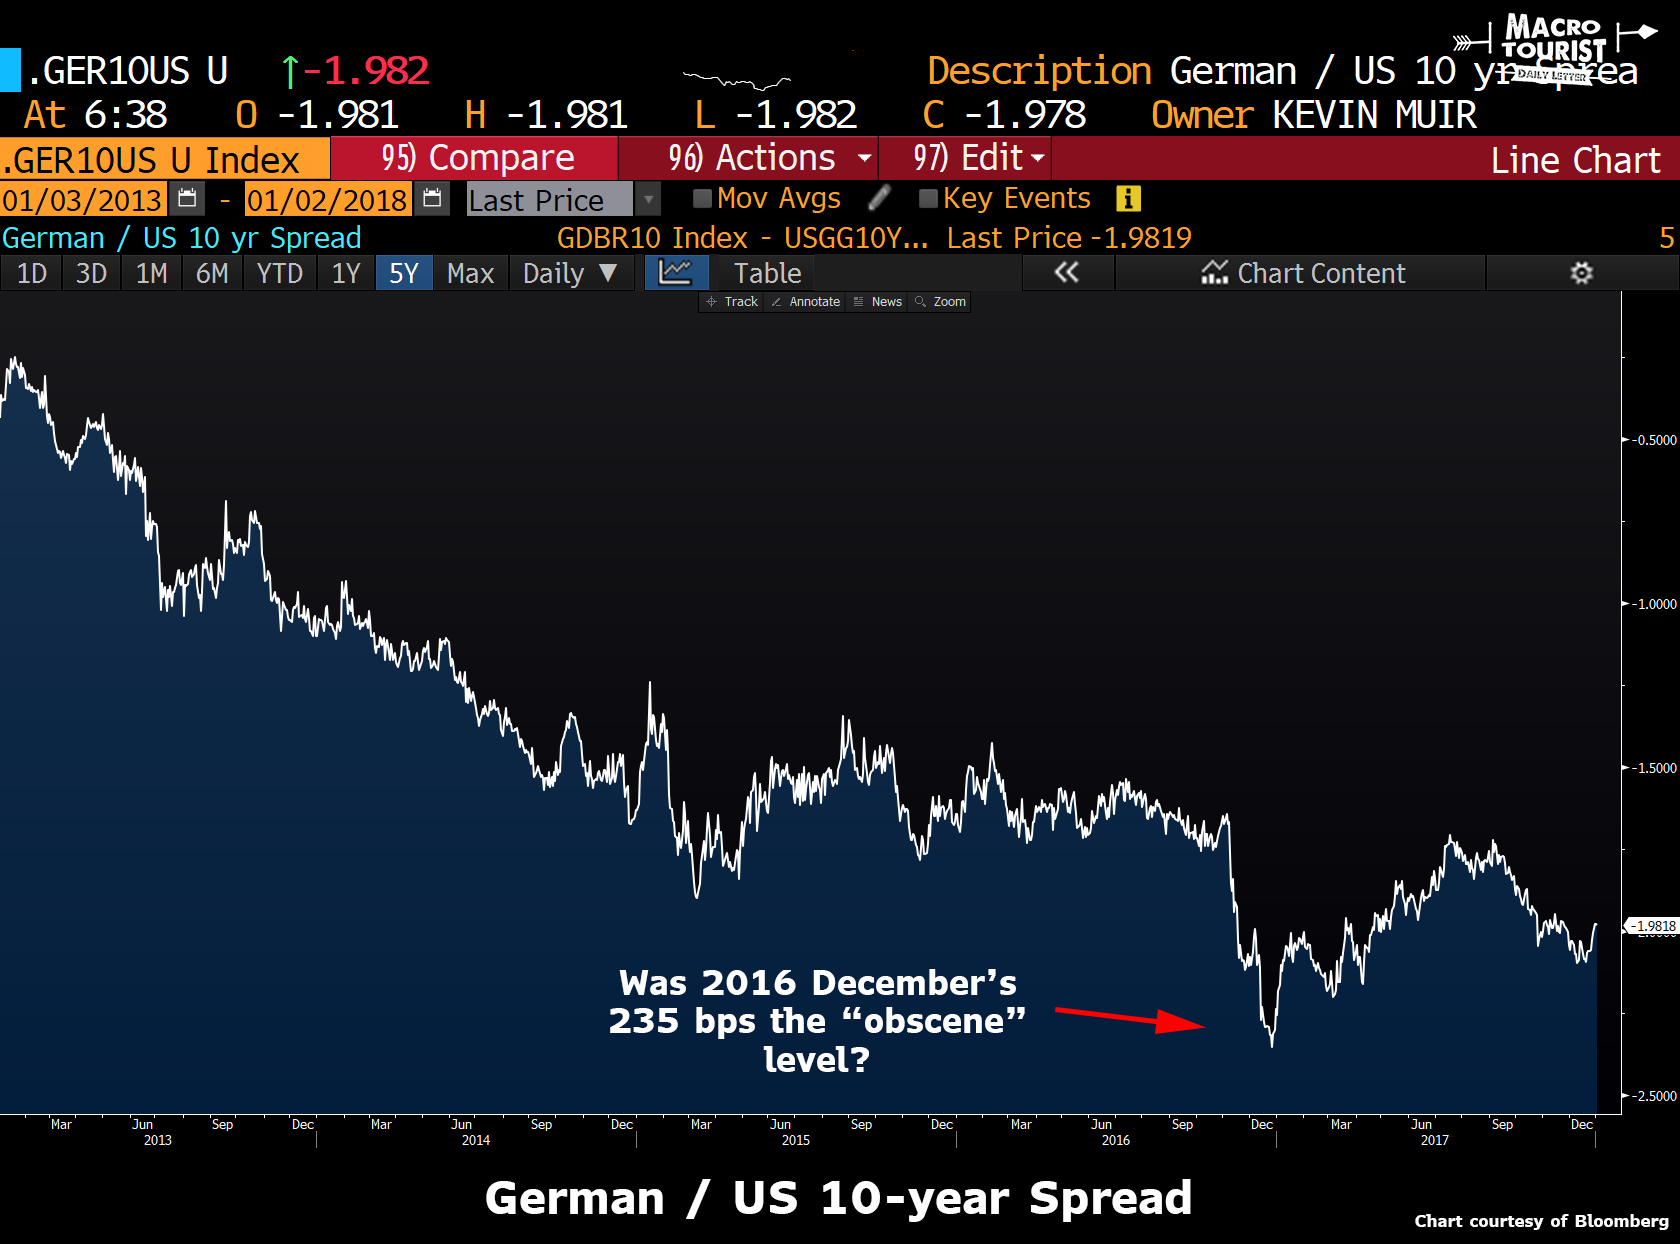
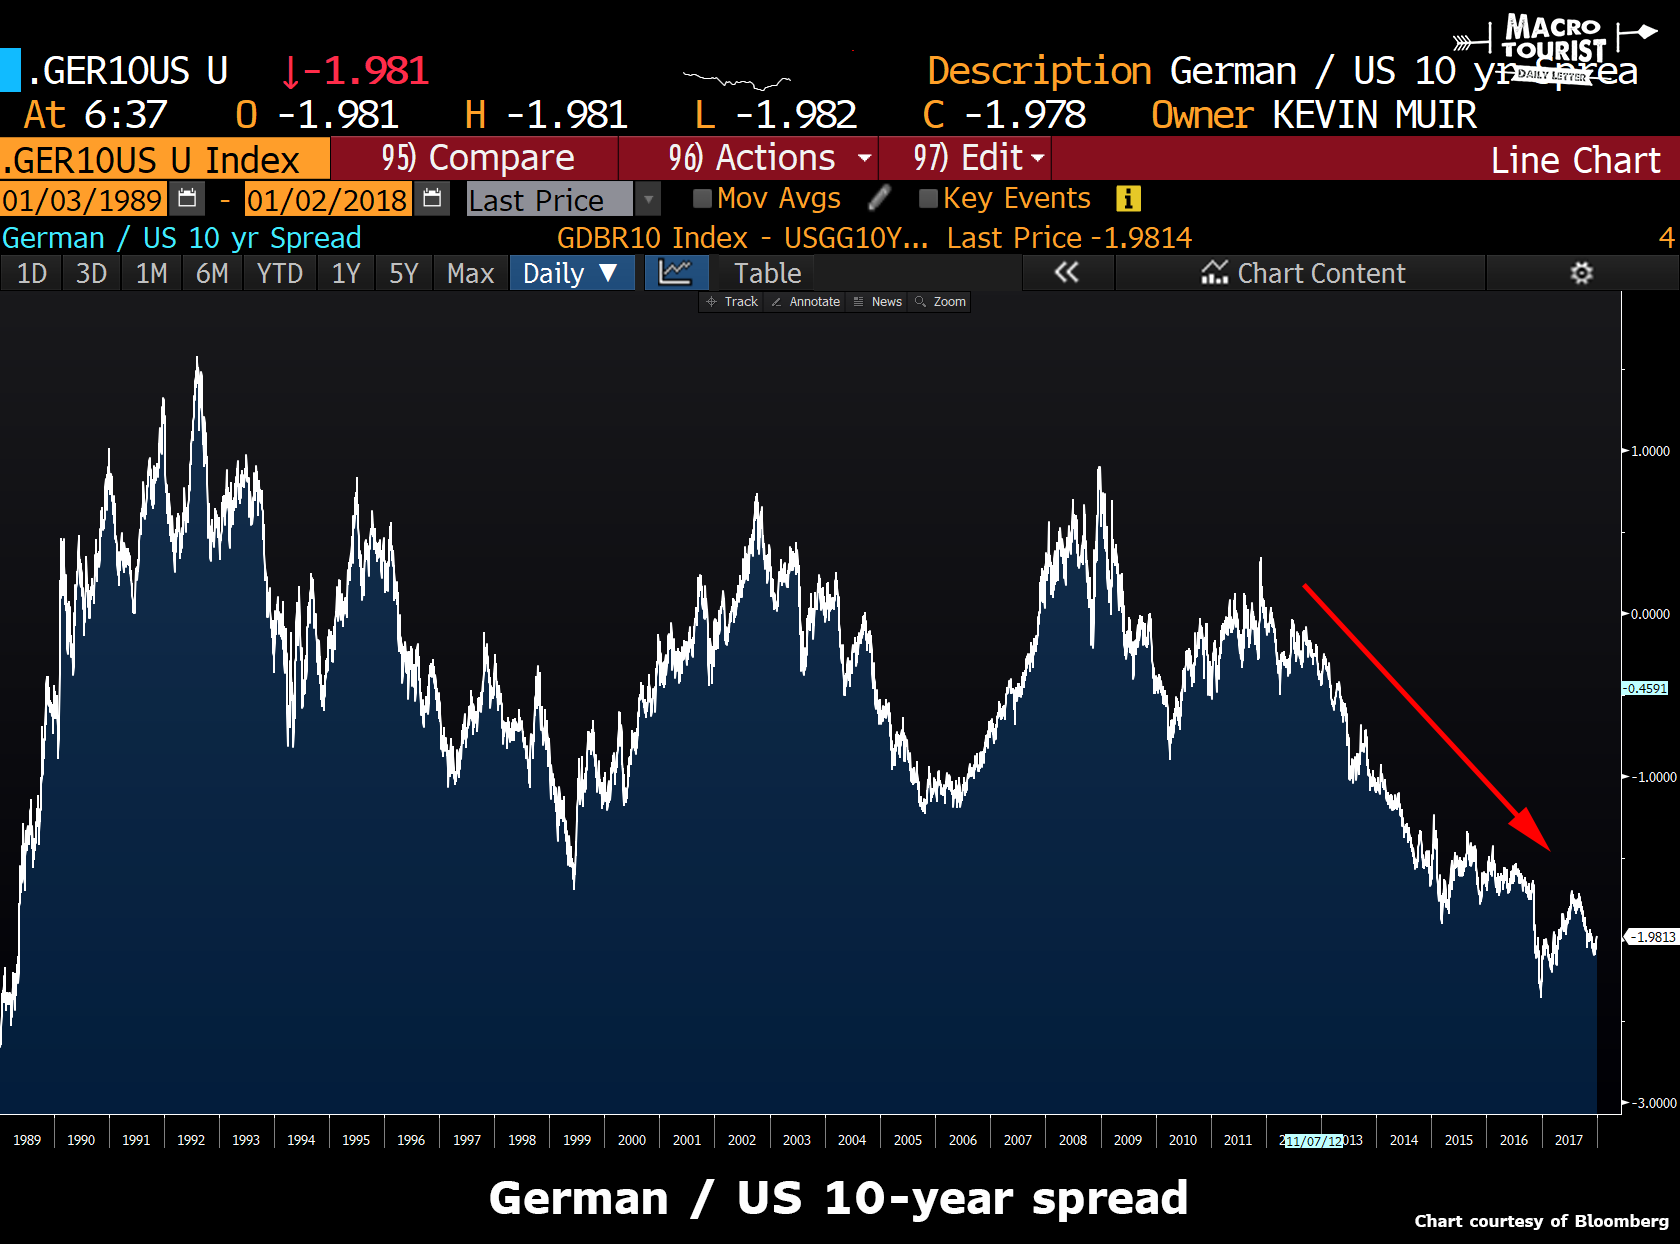
It seemed obscene, but this spread had seen those levels before. Yeah sure, the last time the German bund / US T-note traded below negative 200 basis points I was a 19-year old listening to New Order’s Fine Time on my yellow SONY walkman, but that was back in 1989 – Germany was dealing with the fall of the Berlin Wall and the chaos had thrown German financial markets into a tailspin – so those levels should probably be ignored.
These recent spread wides have occurred in a period of relative economic calm. So maybe the 235 basis points was kind of “obscene.”
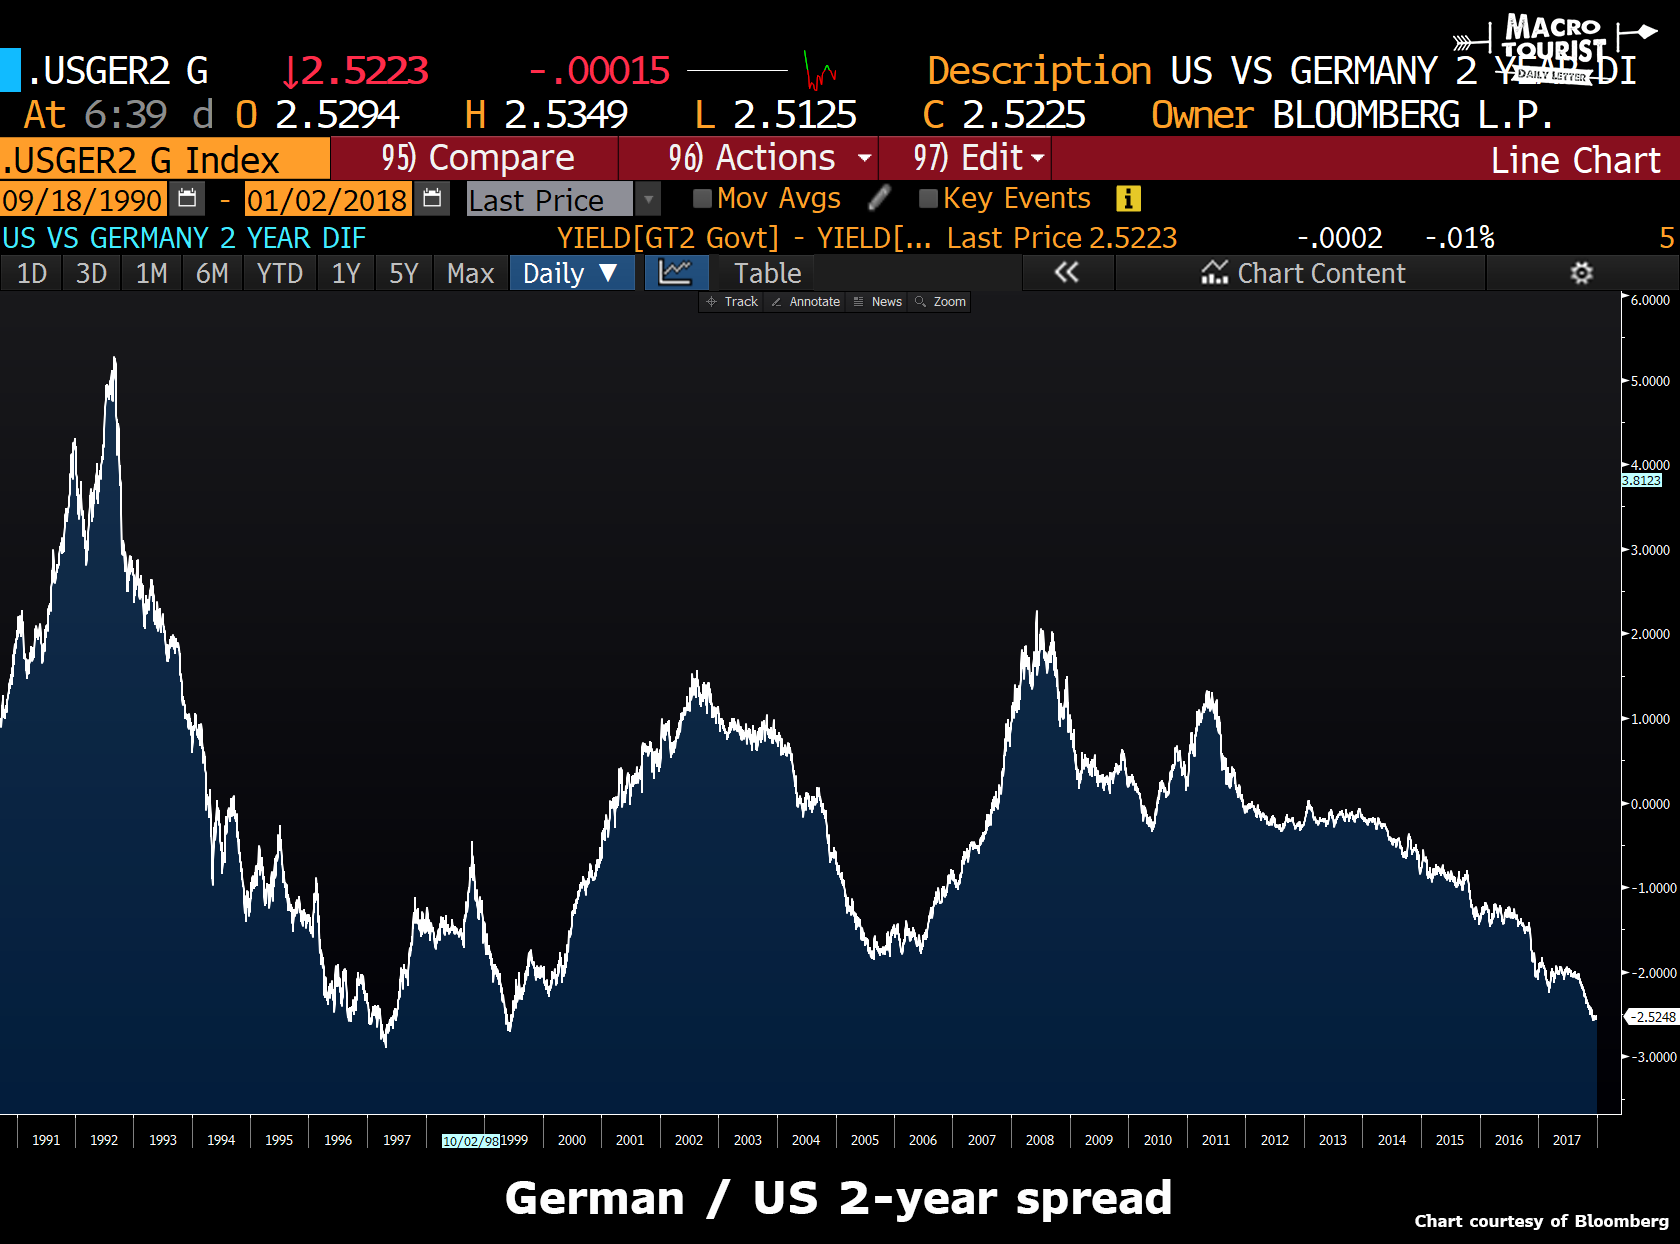
Last summer, there was speculation the ECB might get more aggressive in their balance sheet tapering. This caused German bund yields to back up. However, Draghi & Co. surprised the market by refusing to ease up on the gas pedal as much as expected, and in the process, sent short-term Euro rates scampering back to pricing in no tapering. At the same time, the Federal Reserve did the opposite, and actually followed through with many of their threatened rate hikes, sending short-term yields to new highs for this cycle. Both Central Bank actions had the effect of sending the German / US 2-year yield spread to new wides.

Again, this spread had seen this level before, but this time, it wasn’t 1989, but instead 1996.
Regardless of how long ago the different part of the German and US yield curves have last seen these sorts of levels, there can be no denying that we are in an unique period where German yields have been pushed down to extraordinarily low levels versus US rates.
2-year leading the way
All of these history lessons don’t really help us answer the question about where the German / US 10-year spread is headed. Or do they?


Leave A Comment