
EUR/USD
4 hour
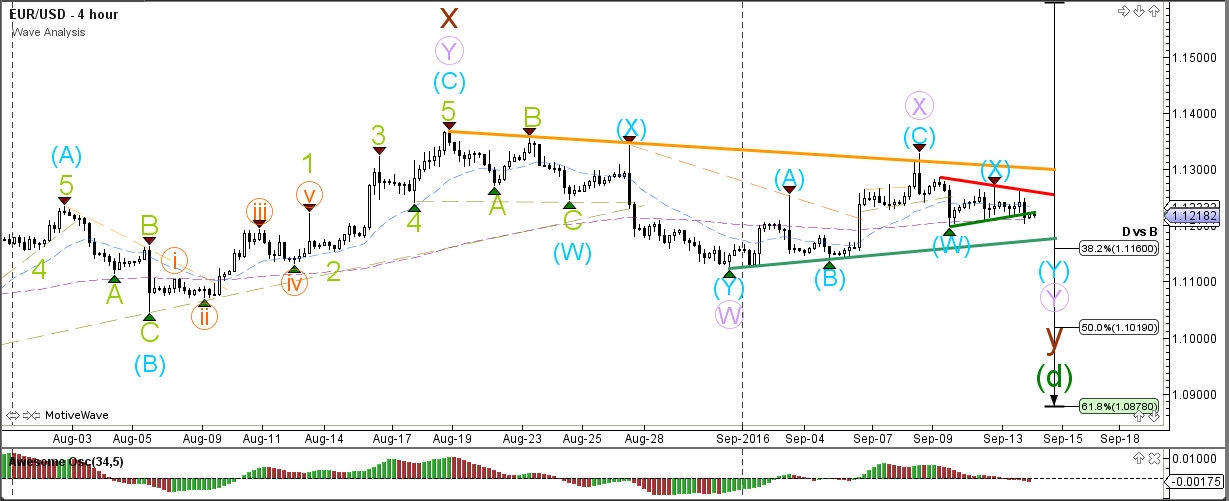
The EUR/USD is trying to break below the smaller contracting triangle chart pattern (red/green lines), which would confirm the development of multiple wave Y’s within wave d (green). A break above the triangle indicates that wave X (blue) is still active. A break above the bigger resistance line (orange) indicates that a different wave X (brown) is still ongoing.
1 hour
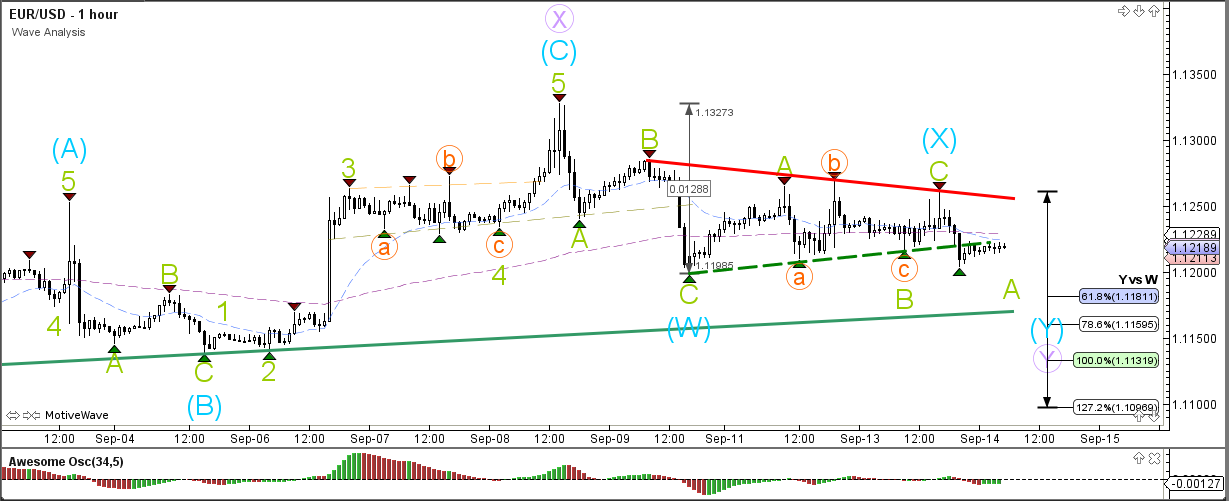
The EUR/USD seems to have completed the complex wave X (blue) correction. The bearish price action is probably the start of wave A (green) unless price breaks above the resistance trend line (red).
GBP/USD
4 hour
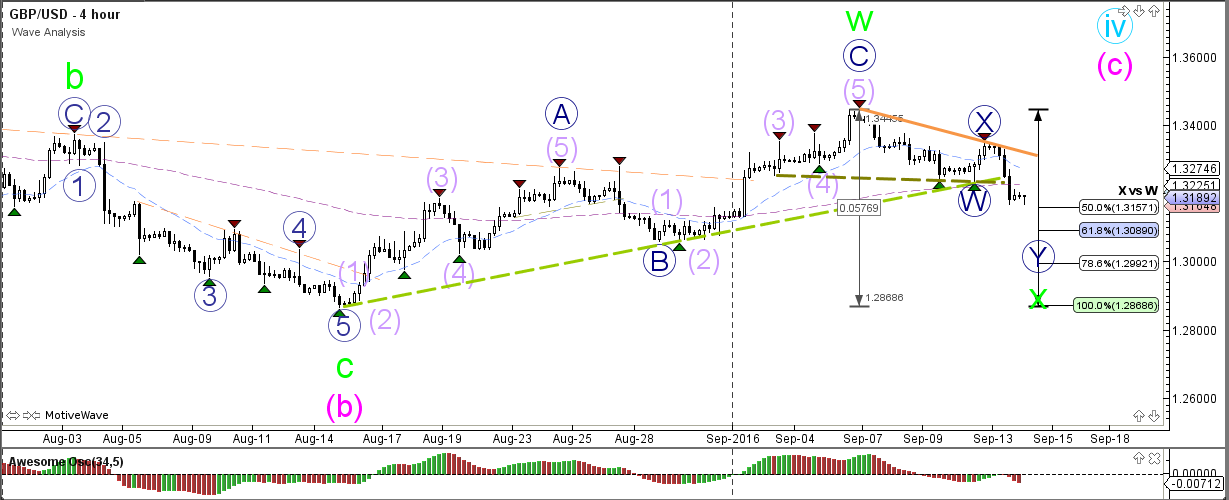
The GBP/USD broke the support trend lines (dotted green) during yesterday’s trading. The bearish break made the impulsive bullish wave structure unlikely and a new corrective bullish structure seems its likely replacement, unless price manages to break below the 78.6% Fibonacci level and 1.30 round level.
1 hour
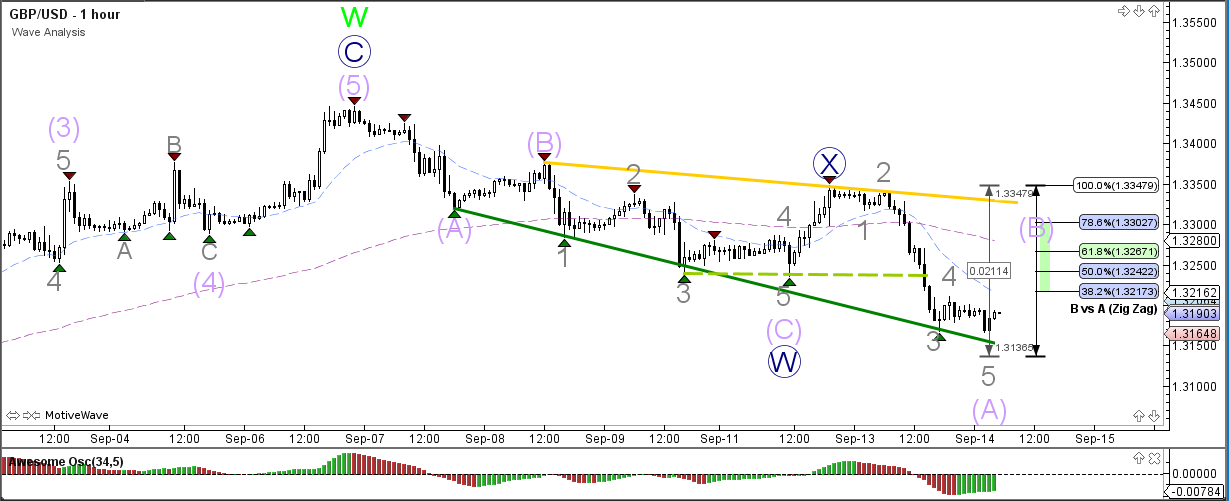
The GBP/USD is probably building a bearish ABC zigzag (purple). The Fibonacci retracement levels of wave B (purple) are most likely expected to offer resistance.
USD/JPY
4 hour
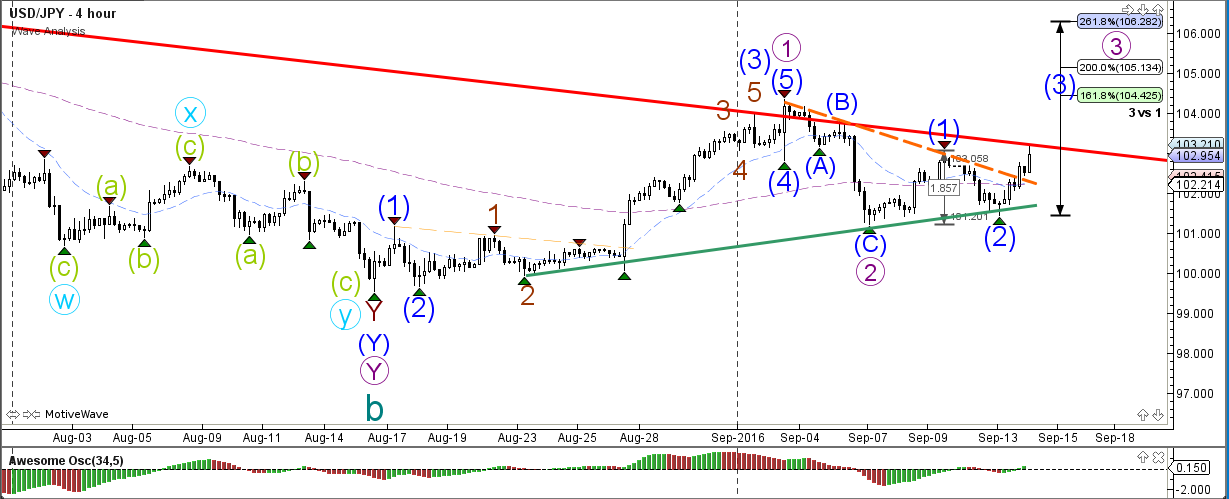
The USD/JPY broke a smaller trend line (dotted orange) and has reached an important break or bounce spot at the resistance trend line (red) of the daily downtrend channel. A break above resistance (red) confirms the end of the downtrend and the start of bullish price action. A break below the various bottoms of this chart invalidates the current wave structure and indicates the continuation of the downtrend.
1 hour
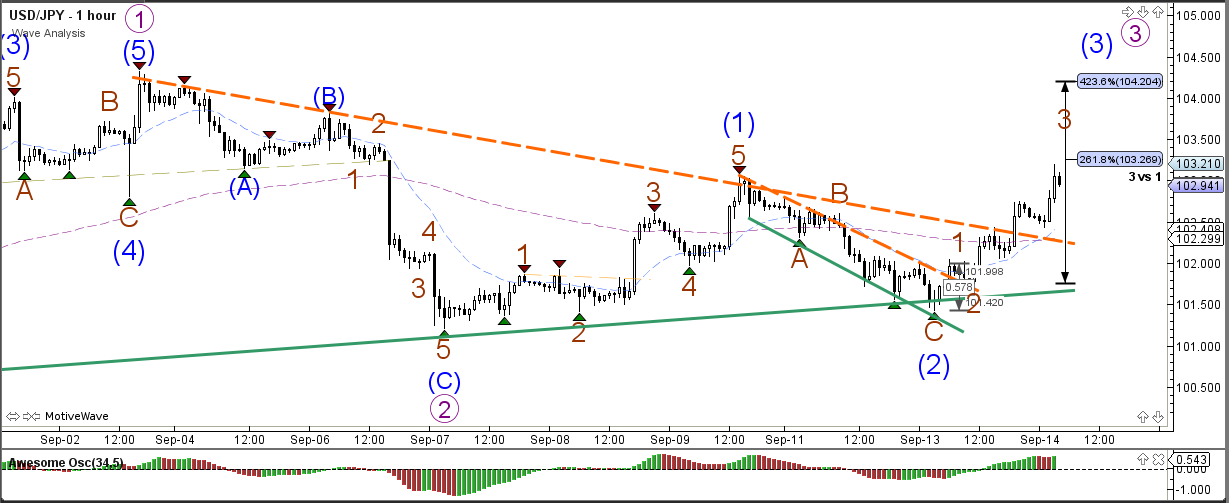
The USD/JPY broke above the channel (dotted orange) as indicated yesterday. Price is expected to build a wave 4 correction after completing wave 3 (brown) within waves 3 (blue/purple).


Leave A Comment