We have a normal data calendar. Central to stock market prospects is the resolution of several key policy issues. The possible outcomes have a wide range of market impacts, from fear to a major boost in corporate earnings. The debt limit/Harvey aid deal between President Trump and Democrats was a surprise to most. Still digesting the implications, the punditry will be wondering:
Have the odds improved for a market-friendly policy agenda?
Last Week Recap
My expectation that of a focus on what might go wrong was partly correct. Then the hurricane news and political reactions became the lead stories. There was little market-moving data.
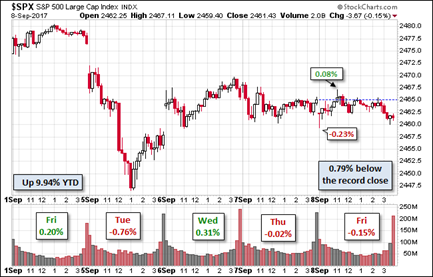
The Story in One Chart
I always start my personal review of the week by looking at this great chart from Doug Short via Jill Mislinski. The most notable feature is the narrow range. The supposed “delayed reaction” to the N. Korean H-bomb story was responsible for the Tuesday dip.

Doug has a special knack for pulling together all the relevant information. His charts save more than a thousand words! Read the entire post for several more charts providing long-term perspective, including the size and frequency of drawdowns.
The Silver Bullet
As I indicated recently I am moving the Silver Bullet award to a standalone feature, rather than an item in WTWA. I hope that readers and past winners, listed here, will help me in giving special recognition to those who help to keep data honest. As always, nominations are welcome!
The News
Each week I break down events into good and bad. For our purposes, “good” has two components. The news must be market friendly and better than expectations. I avoid using my personal preferences in evaluating news – and you should, too.
There was little economic news, but it was generally positive. The negatives were not very significant.
The Good
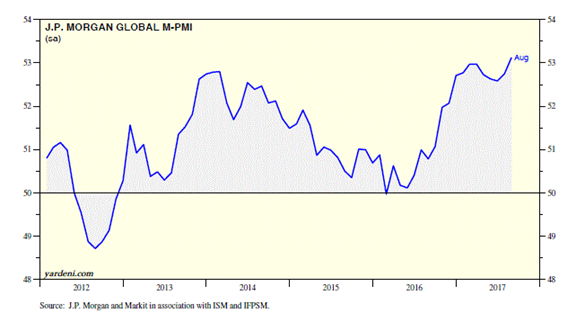
Overall global growth continues. Dr. Ed Yardeni has a good analysis with some interesting charts and explanations. Here is a key quote and a chart example.
The global economy is running on all six cylinders. It may not be a global synchronized boom, but it is the most synchronized expansion of economic activity that the global economy has had since the recovery from the 2008/2009 recession.
The Bad
The Ugly
Irma. Not just another hurricane. The entire state of Florida in the path. Modern modeling and forecasting has helped in evacuating seven million people. One way of measuring the magnitude is the accumulated cyclone energy (ACE), the total wind energy of the tropical system. USA Today has these amazing comparisons:


Leave A Comment